Fraud Blocker Saltus Wealth Index Report January 2024 | Saltus

Saltus Wealth Index Report

January 2024

Share this report:

Saltus Wealth Index Report

The high-net-worth individual’s view of their position, prospects and potential

January 2024

Share this report:

Foreword

This is our fifth Saltus Wealth Index Report...

Jon Macintosh
Jon Macintosh

Managing Partner

For the past few years, we have tracked the views of high net worth individuals (HNWIs) as the UK has experienced a rollercoaster ride of external political and economic shocks alongside internal policy and leadership wobbles.

The views of this audience provide an insightful, instructive and important contribution to our understanding of the prospects for the UK economy in the year ahead.

Our respondents are exactly the people the UK will need if it is to succeed in the coming decades.  They are resourceful, but also, as this survey reveals, they are actively supporting others around them during these challenging economic times. It is notable that, despite the rollercoaster, most of our sample have retained confidence in the UK, although it has taken a bit of a dent over the last few years.

The Saltus Wealth Index itself, a composite barometer of multiple measures, remains in positive territory and has strengthened since our last survey, while not yet reaching levels prior to the Liz Truss premiership. The Index stands at 64.4, a rise of 3.5 on levels recorded by the survey undertaken in the middle of last year, when it was 60.9.

2023 was a year in which the dog could have barked but didn’t. The Ukraine War remained in Ukraine; there was no conflict in the South China Sea; inflation began to be tamed; and the US economy did not have a hard landing. The effects of the conflict in Gaza only spilled beyond its borders recently with the attacks on shipping in the Red Sea.

However, many of these threats remain and they are supplemented by the uncertainty around scheduled elections in 2024. There are important polls in countries whose combined population exceeds four billion. While it does not take a top political scientist to forecast who the winner will be in Russia, there is doubt surrounding the outcome in the US. As always, what happens in America affects us all. In the UK, where there will probably be an election in 2024 (it could be January 2025), our respondents make their views clear who they will vote for. Spoiler alert: this is not comfortable reading for Rishi Sunak.

For me, however, the most striking thing about this research is not what it reveals about respondents’ view of politics, the economy or even their own personal finances. Rather the survey shows the level of commitment British people have to their families, whether that is helping with educational expenses, the mortgage or just making ends meet. It is a warming note in a winter that otherwise could seem rather gloomy.

As always, my thanks are due to our partners at Censuswide and Dr Michael Peacey of the University of Bristol. I hope you enjoy the report.

Commentary

The Saltus Wealth Index synthesises some of the key information gathered from the questionnaire and provides a simple barometer of the subjective confidence and concerns that 2,000 UK high net worth individuals (HNWIs) have relating to the UK economy and their own financial affairs. The Index ranges between 0 and 100, with higher values describing higher confidence in (and fewer significant concerns with) the UK economy and personal finances.

The Index currently stands at 64.4, which represents a modest increase to the previous Index score of 60.9. This suggests that, despite many unresolved uncertainties being carried forward into 2024, there has been an increase in confidence among HNWIs. This is driven by increases in both individuals’ confidence about their own finances and in the UK economy. The trend of increasing confidence in London has seen a very significant rise, with 82% of respondents now believing that London will remain Europe’s financial capital, up from 66% in the last survey, and 62% one year ago. However, confidence is being dampened as concerns over inflation and interest rates become more salient.

There are many interesting findings from the wider results of this survey. For instance, the survey results remind us that, even among HNWIs, economic concerns are felt differently across different groups. For example, people over 55 were 70% more likely to list inflation as one of the biggest risks to their wealth than those who are younger. This may be because the older group are more likely to be focused on the real income their wealth can generate as they approach retirement, or because only this group have experienced the effects of persistent levels of significant inflation during their working lives. But the data also show that, unsurprisingly, HNWIs over 55 were much more likely to own their homes outright than their younger counterparts (83% vs 45% across other age groups), and so will have been insulated from some of the pressures that have come from successive interest rate rises.

The data show that the behavioural responses to the cost of living crisis have been varied among HNWIs and their families. For some it may be things like cutting down on luxury items or switching to cheaper supermarkets but for others the decisions are more significant and long-term, such as delaying decisions about having children, starting businesses or retiring.

There are also several interesting findings in relation to how HNWIs view the taxes that they pay, which is of particular interest at a time when the political parties are writing their manifestos in preparation for the forthcoming general election. Since the last survey, there has been an increase in the proportion of HNWIs who feel their own tax burdens are about right (64% vs 59%). In terms of the specific taxes that HNWIs feel are least fair (and therefore perhaps a focus for politicians), we once again observe interesting differences between those over 55 and the younger age groups. For example, while IHT is by far the least popular tax among the older age group (with 39% feeling it is the most unfair tax), it is not even in the top five for those under 55 (with under 7% disliking this tax most). Of course, HNWIs differ in many ways, not just age. For example, self-employed HNWIs are 27% more likely to feel corporation tax is the most unfair tax compared to HNWIs who are employed.

Executive summary

Rising cost of living sees HNWIs cutting back to provide financial support to their families

The Saltus Wealth Index has recovered much of the ground lost following the Autumn 2022 mini budget and now stands at 64.4, reflecting a more stable UK economy.

There has been a rise in confidence over the past six months amongst HNWIs regarding both the UK’s economic prospects and their own personal wealth. However, the cost of living crisis has had a substantial impact on HNWIs’ behaviour as well as their broader economic outlook.

Almost eight in ten (78%) respondents now feel confident about the UK economy, up from 71% in the last report, with 85% also feeling confident about their own wealth. However, the current economic environment has had an impact on behaviour. Nine in ten (91%) have made cutbacks in their day to day spending, including eating out less, cutting down on buying luxury items and switching to cheaper supermarkets. Almost the same number (88%) say either they or their adult children or grandchildren have delayed ‘big ticket’ decisions and purchases, including starting a family, buying a first or second property and retiring.

This latest research also shows that the cost of living crisis continues to disproportionately impact younger people and this report reveals older HNWIs are offering a vital source of financial support for their families. The majority of respondents say that they are helping their adult children and grandchildren to cover the rising cost of expenditure including private school fees and mortgage payments.

The cost of living crisis is also manifested in what HNWIs worry about, with respondents still seeing inflation as the biggest risk to their wealth and reporting that a weakening economy and their own health are among their biggest fears.

Regarding politics, HNWIs say they expect to see a change in government at the next election and want the next government to prioritise growing the economy, reducing inflation and increasing spending on the NHS.

Changes in the Saltus Wealth Index over time

Reset

Views on the economic environment

Overview

Confidence recovering in the UK economy

Our research shows a notable increase in HNWIs’ confidence in the UK economy and in London as Europe’s financial capital over the past six months.

Almost eight in ten (78%) respondents say they feel confident about the UK economy when considering the next six months, up from 72% in the last report (published in June 2023). A third feel ‘very confident’, which is up from 26% previously.

There has also been a significant rise in the proportion of HNWIs that see London continuing as Europe’s financial capital, with 82% thinking it will remain this way – a substantial rise in confidence from the 66% recorded in June 2023.

Despite inflation falling since the last report, from 7.9% in June to 4.7% in November, it is still seen as the biggest risk to wealth by respondents. 28% of HNWIs say that rising costs are the greatest threat, rising to 45% amongst those aged over 55. Tax changes (27%) and high energy prices (26%) are also cited as top ranking concerns by all respondents, with just 2% saying they cannot identify any risks to their wealth at this time.

Thinking about the UK economy as a whole – not just your own financial position – how confident or unconfident are you about the next six months?

  • Confident
  • Not Confident
  • Neutral / I Don't Know
map of scotland
map of north uk
map of south east uk
map of south west uk
map of northern island
map of UK

UK economic prospects

Younger HNWIs remain the most confident in the UK economy

While our data reveal overall confidence in the UK economy has increased – from 71% to 78% –levels of confidence differ significantly with age.

Younger respondents are the most confident, with 90% of 18-24 year olds saying they feel very confident (52%) or confident (38%). However, amongst those over the age of 55 there has been a notable drop, with only 30% feeling confident about how the UK economy will perform, down from 36% in our previous report. Of this same group, just 7% feel very confident and less than half (44%) have confidence in London remaining the financial capital of Europe.

There is a similar difference when it comes to working status. Our data reveal that retired respondents are much less likely to feel confident in the economy (21%) than those who are still working (81%). While employed HNWIs (84%) are more likely to feel positive about the prospects of the UK economy than those who are self-employed (75%).

Our data suggest that the wealthier the respondent, the more confident they are in the UK’s prospects. Nine in ten (90%) of the wealthiest respondents (those with a net wealth of £3 million or more) say they feel confident about the next six months. However, this drops to just over half (53%) for respondents who have a net worth of between £250,000 and £499,999. Those who have received financial advice are more than twice as likely to feel confident than those who have never received advice of this kind (87% contrasting with 32%).

Confidence in the UK economy by age of respondent

Reset

Confidence in the UK economy by net worth of respondent

Reset

HNWIs’ confidence in UK economy over time

Reset

Key risks to wealth

Inflation remains the top concern for HNWIs

Even though inflation has fallen since the last Wealth Index Report, from 7.9% (June 2023) to 4.7% (November 2023) and now to 4% (December 2023), it remains relatively high and is consequently still seen by HNWIs as the biggest single risk to their wealth, particularly amongst older respondents. Overall, 28% of HNWIs cited inflation as the biggest threat they face – unchanged since the last report – but, amongst people over 55, the proportion worried about rising prices has risen from 39% to 45%.

Other than inflation, our data reveal a cluster of key concerns among HNWIs including tax changes (27%) and high energy prices (26%), which reflects a similar picture to our previous report back in June 2023.

Despite the fact that the base rate – and therefore mortgage rates – have fallen since the last report, rising mortgage rates are still as much as a concern now (20%) as they were for HNWIs six months ago (18%). This may reflect increased costs faced by homeowners who have had to remortgage at higher rates in this period. According to the Bank of England1, a further 2.5 million homeowners will be coming to the end of their fixed deals in 2024, and therefore will face a significant increase in monthly payments over the coming 12 months.

HNWI views on biggest risks to wealth

Reset

Personal finance

Overview

Nine in ten HNWIs have changed their spending habits as a result of the cost of living crisis

The ongoing cost of living crisis has had a significant impact across the country. This concerns HNWIs both directly, in terms of impacting their own financial priorities, and indirectly, because rising costs are also affecting their loved ones.

Nine in ten (91%) respondents say the rising cost of living has hit their day-to-day lifestyle, forcing them to cut back on things like personal spending, eating out and holidays. Some are also switching to a cheaper supermarket (14%) as well as making more significant changes such as reducing pension contributions (13%) or remortgaging (4%) to stay on top of monthly payments.

For 88% of respondents, rising costs mean they have delayed important decisions, including starting a family, buying a property or taking early retirement.

Our data suggest that retired HNWIs have been the least impacted by the cost of living crisis, with 73% saying they have not been affected compared to just 7% of those who are currently employed.

However, the indirect impact of the cost of living crisis can be seen clearly by the number of older HNWIs who are providing financial support to family. 70% are providing financial support to their adult children, 7% have had their adult children move back in and 79% are helping out their adult grandchildren.

The report also looked at how HNWIs feel about the current tax and pension rules in the UK. Almost nine in ten (88%) HNWIs want to see pension reforms. The changes they would most like to see include a further increase to the annual allowance (18%), an increase to the 25% level of tax-free cash (17%) and the introduction of a ‘pension pot for life’ (19%) – as proposed in the 2023 Autumn Statement.

HNWIs would also like to see changes to the current tax system in the UK. Respondents feel corporation tax is the least fair tax, followed by capital gains tax. Unsurprisingly, this view is particularly strongly held by self-employed respondents. Whilst inheritance tax (IHT) is often considered as the tax most disliked by HNWIs, our research found that the majority of respondents (70%) would not choose to remove IHT entirely but would rather prefer to see the current rate fall to 20%.

The rising cost of living

Rising costs lead to nine in ten HNWIs changing their day-to-day spending

Our research shows that the vast majority of HNWIs have been impacted by the cost of living crisis and have changed their day-to-day spending as well as their longer term financial priorities as a result.

One in seven (16%) have reduced personal spending, cut down on eating out and buying luxury items, 15% spend less on holidays, hobbies and entertaining, and 14% have switched to shopping at a cheaper supermarket.

For other HNWIs, the changes have been more significant. One in eight (13%) have reduced pension contributions and the same number say they have borrowed money from a friend or relative or sold an asset to help with finances. One in 10 (11%) have raised cash through their primary property by changing to an interest only mortgage, remortgaging to reduce payments or even selling their house and moving to a cheaper property. In London, this number rises to 15% (with 6% saying they have sold up and 9% either remortgaging or switching to interest only payments).

The impact has been even further reaching for some respondents, with almost nine in ten (88%) saying either they or their children or grandchildren have delayed a big life decision. Of this group, 15% have delayed starting a family or having another child, 12% have postponed buying their first home, while one in five put a hold on buying a second property. One in five (20%) have delayed moving abroad, the same number have not started a business, while 12% have put back their retirement. One in 10 (10%) have even delayed getting divorced as a result of the current financial climate.

"Clients using surplus income to support younger generations has always been quite common, particularly with things like school fees. However, I am now increasingly having conversations with clients about how they can use their portfolios to provide additional support to children and grandchildren who are struggling with rising costs, while others are starting to tap into as-yet untouched investments to fund that sort of support. Another noticeable change I've seen is that clients are making fewer ad-hoc pension or ISA contributions; this is because the savings they have built up throughout the year are increasingly being used to provide financial support to their children and grandchildren, rather than towards building up their own investments. Although understandable, it is important a balance is found to make sure this doesn't have knock-on impacts to their future plans."

Megan Jenkins
Chartered Financial Planner at Saltus

Changes HNWIs have made in response to rising costs

Reset

Supporting the wider family

Three quarters of HNWIs are providing financial support to their adult children or grandchildren

Six months ago, the Saltus Wealth Index Report showed that while the cost of living crisis was impacting virtually all HNWIs to some extent, for older respondents the impact was more direct, with a large proportion supporting their adult children financially.

Six months on this is still very much the case, with this new research showing that 70% of respondents are supporting their adult children (rising to 84% of those aged 45-54 years old). On average, they have given just under £10,000 over the last year.

An even higher proportion of older respondents (79%) are supporting their adult grandchildren, giving on average just under £11,000 over the past 12 months.

Of those that are providing support, many have had to make sacrifices to their own lifestyle or financial stability to do so. Almost one in five (18%) have cut down on their own spending, the same number have tapped into housing equity and 15% have reduced pension contributions to free up cash to help.

Over the past year, private school fees have risen 5.6%2 while student loans have failed to keep up with inflation, leaving students with less money to cover their living costs. As a result, one of the most common ways in which HNWIs are providing support is to cover the cost of education.

This research suggests that four in ten (42%) HNWIs are helping with educational costs, including university fees for their own adult children or grandchildren and paying school fees for their grandchildren or great-grandchildren.

How HNWIs are supporting their wider family financially

Reset

Taxes and inheritance

Only 6% of HNWIs want to see the removal of inheritance tax, but vast majority would like to see it reduced

Despite often being branded the ‘UK’s most hated tax’, the Wealth Index Report suggests HNWIs do not hate inheritance tax (IHT) as much as many believe, with just 6% of respondents saying they think it should be removed completely. However, nearly one in ten (9%) respondents do think IHT is the ‘least fair’ tax and the vast majority (90%) think it should be cut from 40% to 20%. .

It is a very different story, however, amongst older respondents. The over 55 age group overwhelmingly believe IHT to be unfair, with 39% of respondents voting it as the single most unfair tax – four times the number that felt this strongly about any other type of taxation. 45% of respondents in this age bracket think it should be removed entirely. 38% of people over 55 think IHT should remain but at a lower rate; most would like to see it cut below 20% and, on average, respondents in this age group believe 13% would be the ideal rate.

Overall, most HNWIs (64%) think they currently pay the right amount of tax, however, almost a third (31%) think they pay too much, which is down 5% since our last report. The taxes they feel are the most unfair are corporation tax (15%) and capital gains tax (13%), followed by IHT (9%).

HNWIs’ views on inheritance tax

Reset

Pension reforms

Nine in ten HNWIs want to see pension reforms of some kind

The Wealth Index Report shows that the vast majority (88%) of HNWIs do not think pensions work as well as they should, and they would like to see reforms. The change that would be most popular would be the introduction of a ‘pension pot for life’, as announced in the Autumn Statement, with 19% of respondents saying they’d like to be able to insist their employer pays into their chosen scheme, rising to 21% for respondents over the age of 55.

The next most popular reform would be a further increase in the annual allowance. 18% of respondents would like to see this, rising to 25% for self-employed HNWIs. An increase in the 25% level of tax-free cash would also be a popular change, with 17% of respondents saying they would like to see the level raised. This increases to 23% of the wealthiest respondents. While 13% of all HNWIs in our research would like all inherited pensions to be accessed tax free.

"Pension reforms are often used to gain political points, and while in theory these ‘headline grabbing’ announcements sound positive, they are often not as straightforward as they sound, and generally come with plenty of caveats. Our report shows that HNWIs would like to see reforms and, while my clients would certainly welcome changes that make pension saving easier and more tax efficient, what they really want is clarity, certainty and refrain from constant adjustments, so that they can actually plan their retirement. Having said that, there are some key reforms that would make the system fairer, for example, changing the tax-free element from £268,275 to a more easily remembered £300,000 and the removal of Death in Service benefits from the Lifetime Allowance calculation - it is shocking that an employee benefit designed to provide financial security in the event of death can be taxed higher than the rate for IHT."

Gianpaolo Mantini
Chartered Financial Planner at Saltus

HNWIs views on pension reforms

Reset

Savings for retirement

HNWIs are looking to boost their pension pots

The last few years have been uncertain in terms of return on investments, and, for many HNWIs, there is a possible concern that they’re going to fall short of their retirement objectives. As a result, Saltus has seen some clients start to reassess their financial plans, both in terms of the amount they are prepared to invest as well as how much risk they are prepared to take. This experience is backed up by findings from the latest Wealth Index Report.

The research shows that while, on average, HNWIs contribute £35,400 a year into their pensions, and currently have a pension pot worth an estimated £483,600, respondents think they are falling far short of where they need to be to allow for a comfortable retirement.

The sample as a whole believes that a pot of £536,000 on average is needed for a comfortable retirement. However, HNWIs nearing retirement (those aged 55 years old or above) think a pot of £661,700 is needed, which is over £100,000 less than they say they currently have saved.

As a result, seven in ten (69%) HNWIs are planning on increasing their pension contributions over the next six months, up from 64% indicated in our last report. Our data also show a rise in the amount HNWIs want to increase their contribution by, from an extra £613 a month when surveyed six months ago to an additional £848 per month now.

As a result of rising interest rates and inflation, annuities, which provide a guaranteed income for life, are once again proving a popular use of retirement savings, with 37% of respondents planning to buy an annuity with their pension pot, the most popular option for this cash.

HNWIs’ view on what size pension pot is needed for a ‘comfortable retirement’

Reset

Current concerns

Overview

HNWIs worry about their health and economy but see wealth as a source of freedom

When asked about their biggest worries, our data suggest three key concerns among HNWIs. Their own health (15%), the economy weakening (14%) and the stock market falling (14%) were the three highest ranked concerns. These were followed by worries about geopolitical risks, such as the war in Ukraine and instability in the Middle East (9%).

Concerns around their own wealth remain at similar levels to six months ago. Almost two thirds (65%) of HNWIs say their money makes them anxious, and the younger the respondent, the more anxious they are likely to feel.

However, while wealth causes feelings of anxiety for some HNWIs, the vast majority (82%) also see it as a source of freedom. This has remained relatively stable over the past 12 months, with 80% of respondents agreeing with this sentiment back in January 2022, rising to 84% in June 2023.

The research shows that the majority (93%) of respondents have made plans for passing on wealth, up from 87% last time. There has also been an increase in the number of HNWIs who have discussed their wealth with a financial adviser, made a will or explored donating to a charitable trust.

For the first time, the Wealth Index Report has also explored the political views of HNWIs. Just 16% of HNWIs in this research say they would vote Conservative if a General Election were held today, while 27% say they would vote Labour. However, voting preferences are found to vary by age, with 18-24 year olds (30%) more likely to vote for Labour than any age group, and over 55s most likely to vote Conservative (29%).

Furthermore, and regardless of their political persuasion, almost a third (32%) of HNWIs think Labour will win the next election, compared to just 13% of respondents who think the Conservatives will remain in power.

Biggest worries

Personal health and the economy are top concerns for HNWIs

Our data highlight three main worries among HNWIs. Health has overtaken financial issues as the top concern for HNWIs, with 15% now citing it as their biggest worry, up from 9% just six months ago.

Weakness in the economy remains a top concern for 14% of respondents. This is consistent with the June 2023 findings (13%), where it was the highest ranking worry among HNWIs. The stock market falling is also a top worry for 14% of respondents – nearly double the proportion that worried about the markets six months ago (8%). Perhaps unsurprisingly, given the conflict in the Middle East and ongoing war in the Ukraine, geopolitical risks have risen among respondents, up to 9% of the sample from 5% in the summer of last year.

In addition, this research shows that 8% of respondents are concerned about paying their mortgage, up slightly from 5% in June 2023. This may be driven by homeowners having had to pay more for fixed rate mortgages expiring over the summer and early autumn or worrying about higher payments on fixed mortgages about to come to an end.

What, if any, is your biggest worry?

Reset

Anxiety about money

Money continues to be a driver of anxiety among HNWIs

Wealth continues to be a key contributor to anxiety among HNWIs, with 65% of respondents reporting that their money makes them anxious, essentially remaining at the same level as previously reported (64%).

Younger HNWIs are more than twice as likely to feel anxious than older HNWIs. 72% of respondents aged 18-24 report that their money makes them anxious, compared with just 31% of people over 55.

The wealthier the respondent, the more likely they are to say their money makes them anxious. Just over half (54%) of those with wealth of between £250,000 and £499,999 report this worry compared to 74% of those with a net worth of between £2-3 million.

However, while money drives anxiety, the vast majority (82%) of HNWIs also see it as a source of freedom, rising to 89% for those aged 45-54 years old. This measure has grown strongly from the low of the first Wealth Index Report in October 2021 (76%), but now appears to be levelling off with smaller rises in more recent surveys.

HNWIs’ feelings of anxiety and freedom concerning their finances

Reset
Reset

HNWIs’ money anxiety over time

Respondents agree with the statement: My money makes me anxious

Reset

Political views

HNWIs expect Labour to win the next General Election and want to see a government prioritise growing the economy, reducing inflation and the NHS

This survey suggests more HNWIs would vote Labour (27%) than Conservative (16%) in the next election if it took place today. These findings, however, vary substantially by age, but only people over 55 are still more likely to vote Conservative than any other party.

Political preferences also varied by wealth, with 38% of those with a net worth of between £250,000 and £499,999 most likely to vote Conservative compared to Labour (32%). This falls to 19% for those with a net worth of over £3 million, with 33% of the wealthiest respondents in our research stating they would vote Labour.

Whatever their voting intentions, our survey suggests that more respondents think the Labour Party will form the next government (32%) than think the Conservatives will retain power (13%). People who are over 55 and who would vote Conservative overwhelmingly think Labour will win the next election (70%), despite their personal preference.

Overall, HNWIs think the next government (regardless of party) should prioritise growing the economy (23%), reducing inflation (20%) and increasing NHS spending (18%). However, there are some significant differences by age. For example, after the economy and NHS – which are top priorities for both the youngest and oldest age groups – 18-24 year olds want the government to prioritise house building (17%), while people over 55 want to ‘tackle the refugee crisis’ (39%).

HNWIs’ views on the biggest priorities for government

Reset

Threats to private education

Private Education Icon

Overview

Respondents are planning for school fee price rises and the possible addition of VAT

Respondents have made (or are considering making) big changes to accommodate the rising expense of their children’s education as a result of the cost of living crisis.  Only a minority of High Net Worth Individuals (HNWIs) – just 14% – believe that they will not have to reconsider how they fund private education for their children or grandchildren at all.

These financial pressures would of course be compounded were a future Labour government to impose VAT on school fees.  In this scenario over a quarter of parents or grandparents say that their children or grandchildren would have to move to a state school.  If this were to happen it would lead to a seismic change in the UK’s private education sector.

How cost of living pressures are affecting decisions relating to education

The cost of living crisis is already having a substantial impact on how parents will fund school fees.  Some families are compelled to re-evaluate the value of private education and switch to state schools, some are looking at cheaper alternatives and some are looking at different ways of finding the money to pay the fees.

In total 29% of respondents are considering switching from independent to state schools or have already made this decision (10% of our sample).  Approximately a third of parents in this segment are choosing a variant that brings its own costs, moving house to the catchment area of a high quality state school.

Although 24% of HNWIs with children are not affected by a cost squeeze because they either have sufficient funds to cover school fees or they have already chosen state provision, a large proportion of the remainder of the sample who are committed to private education are looking to achieve this goal more cheaply.  8% of the sample are looking to either move their child to a cheaper school or switch them from boarding to becoming day pupils.

A large proportion of the sample are looking for alternative sources of financing to pay the fees. 9% of respondents are looking to family or friends for support and 15% are looking to borrow, the bulk of whom are looking to equity in their house for this funding.  This is an issue that affects grandparents too, with some grandparents reporting that their grandchildren have moved out of private school and others increasing the amount they pay to subsidise their grandchildren’s education.

Thinking about the rising cost of private school fees, which of the following statements do you most agree with?

Reset

How parents and grandparents would react to VAT on school fees

Applying VAT to school fees would ratchet up the pressure on parents.  26% of respondents say they would move their children or grandchildren to a state school and 50% of the sample say that their children or grandchildren would trade down to either a cheaper private school or make the change from boarding to day.  Only 21% of parents and grandparents say that the imposition of VAT would lead to no change for their dependants.

If a future government started charging VAT on private school fees, what would your most likely course of action be?

Reset

Methodology

  • 2,000 UK respondents (aged 18+) who have £250k+ of investable assets – including a full breakdown by age, gender, regional location, city location, number and age of children, number and age of grandchildren, number of dependants, marital status, employment status and level, hours worked per week, industry of employment, private versus public sector, net worth, mortgage status, net worth, assets and the level of financial advice they have received.
  • Censuswide (Censuswide abides by and employs members of the Market Research Society, based on the ESOMAR principles).
  • Carried out online in December 2023.
  • Some of the figures in this report have been rounded to the nearest whole number. This means that in some cases the total value of a graph will be above or below 100%. The original data provided by Censuswide included data accurate to 13 decimal points. The data has been rounded, where relevant, to present the clearest picture to readers of this report.

The formula which drives the Index is as follows:

Wealth index formula

This is the sum of the seven measures outlined below, Mi multiplied by their corresponding weights, wi.

  • Confidence in respondent’s own finances
  • Confidence in the UK economy
  • Proportion of respondents who are not concerned by either
  • Inflation or interest rate rises
  • Confidence in London remaining as a financial centre
  • Anxiety about money
  • Belief in the freedom that money can give
  • Belief that taxation is too heavy or too light

About Saltus

Saltus is a wealth management company that combines empathy and intellect in equal measure. We help our clients achieve their goals in life through expert financial planning as well as providing sharp focused investment management.

We started life as an investment management firm in 2004, yet over the years we saw that providing high quality investment management is just one of the ways we can help people achieve their aspirations.

Saltus Financial Planning was launched in 2015, with the aim of being an industry leader in providing financial advice. Saltus now employs over 200 people, and we have the privilege of looking after over £3.2bn for our clients.

Saltus Financial Planning Ltd is authorised and regulated by the Financial Conduct Authority. Information is correct to the best of our understanding as at the date of publication. Nothing within this content is intended as, or can be relied upon, as financial advice. Capital is at risk. You may get back less than you invested. Tax rules may change and the value of tax reliefs depends on your individual circumstances.

Click here to download a PDF of the January 2024 report

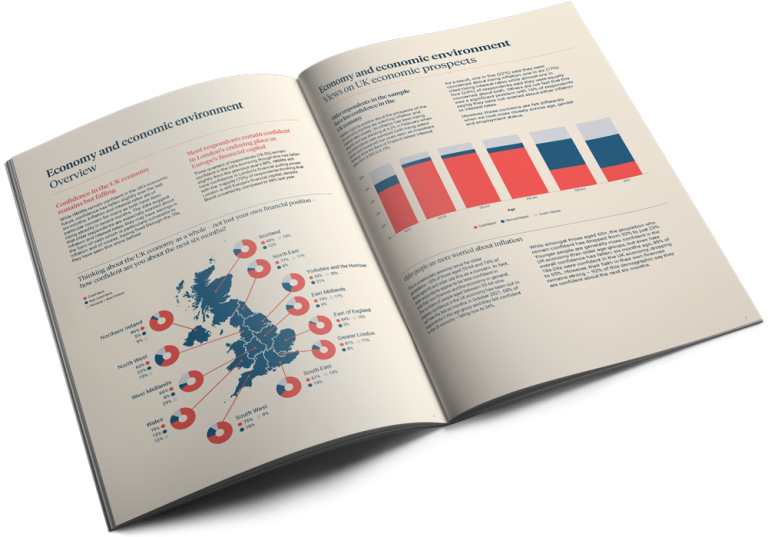
Saltus Wealth Index January 2024 thumbnail

More indexes...

Saltus Wealth Index Report cover September 2024

Wealth Index Report

September 2024

Saltus Wealth Index Report cover June 2023

Wealth Index Report

June 2023

About Saltus?

Find out more about our award-winning wealth management services…

Winner

Top 100 Fund Selectors 2024

Winner

Best Places to Work 2024

Winner

Best Financial Advisers to Work For

Finalist

Investment Performance

Winner

Top 100 Fund Selectors 2024

Winner

Best Places to Work 2024

Winner

Best Financial Advisers to Work For

Finalist

Investment Performance

£7.5bn+

assets under advice

20

years working with clients

300+

employees

98%

client retention rate

£7.5bn+

assets under advice

20

years working with clients

300+

employees

98%

client retention rate

Get in touch