An all-too-common issue in the UK is our attachment to having cash in the bank. This is a problem that was exacerbated by the COVID pandemic as spending decreased and stock market volatility returned. In fact, household savings reached their highest level since formal records began in 1987. “That’s not a problem?!” I can hear you thinking… “we’re all getting wealthier and are building up our cash reserves – great!”. Unfortunately, the opposite could be the reality. As our levels of cash build, we are effectively accumulating an ever-depleting asset and losing ‘money’ at a rate of knots. The belief that cash always brings security is generally founded on misinformation. As such, many of us either have misconceived ideas as to what to do with our cash or suffer from severe apathy and simply let it build. Maybe cash isn’t king after all…
Understanding the cash in your bank account
The Consumer Price Index (CPI) is the primary measure of inflation the Government uses. To determine the rate, they create a ‘basket’ consisting of 720 goods and services that is designed to represent what the average person regularly spends their money on. They then take the average price of all the items and assess how this price changes. In 2019, for example, CPI was 1.3%. Assuming the interest on your current account is non-existent, (like mine!) this meant that in 2020, the cash in your bank account would buy 1.3% less of the goods in the basket. The purchasing power of your money literally falls year on year. The Bank of England even targets a 2% inflation rate, so it’s a fairly consistent pattern of depreciation too.
However, the CPI basket is rarely representative of what you personally spend your money on. Unless, of course, you find yourself regularly puffing on cigars, reaching for your windsurfing board, carrying a bag of coal, or putting together your adult jigsaw puzzle… yes, all of those were in the 2020 basket of goods! Sounds like one wild weekend. Jokes aside, it highlights an important reality – CPI is an arbitrary measure, based on an average, so will rarely be applicable to your own circumstances. It should be considered a very rough guide, at best.
Your personal inflation rate
To truly understand how inflation impacts you, you need to calculate your ‘personal inflation rate’. You can dive into ONS figures and online data to determine this but there are also various personal inflation rate calculators available online. I recently gave this a go myself and analysed six months of my credit card and bank statements to calculate my own personal inflation rate. Interestingly, my rate was a whopping 3.69%. This is far higher than the current CPI figure, and my spending patterns aren’t particularly unusual or lavish. Whilst I was slightly shocked, this is an extremely common finding. Rarely will an individual’s personal inflation rate sit at the same level as CPI. For high-net-worth individuals, it can creep much higher than mine – check out the Forbes ‘cost of living extremely well index’ that has averaged north of 5% since it began in 1982.
What does this mean? Well, with a personal inflation rate of 3.69%, if I had £500,000 and left it in a bank account for just 3 years, with interest at the average base rate, I would suffer a loss in real terms of £49,392. That’s almost £1,400 a month! Even if I sourced the highest interest rate savings account available, I would still lose £41,445. If you were watching that money fly out of your bank account, you’d be utterly horrified. However, simply because the number stays the same on our screens, we don’t give it any real consideration when trying to make informed decisions about our money.
Do you need help managing your investments?
Our team can recommend an investment strategy to meet your financial objectives and give you peace of mind that your investments are in good hands. Get in touch to discuss how we can help you.

Loss aversion theory
The loss of purchasing power your cash suffers over time is the reason why almost every economist will suggest that NOT investing nearly always causes the greatest ‘loss’ to an investor. Unthinkable?!? Surely taking market risk is more likely to cause loss than sitting in cash? Well, statistically, no. If we take the last 121 years, sterling has barely kept up with CPI. By comparison, UK equities returned around 4.7% annualised. A person holding cash gave up well over 90% of available returns over this period. This figure becomes even more depressing when you also consider the impact of their personal inflation rate. On a numeric basis then, perhaps even risk averse individuals should be avoiding cash? Statistically, they are more likely to be worse off by holding onto it – it’s almost guaranteed. All sounds a bit contradictory and odd though, doesn’t it?
The explanation can be found in behavioural economics and something called the ‘loss aversion’ theory. This term was first coined by Nobel prize winner, Daniel Kahneman, and Amos Tversky in a 1979 paper on subjective probability. A basic summary is that humans feel the pain of loss twice as powerfully as the pleasure of gain. Simply put, their research demonstrates that we are chemically wired to prefer not losing a £20 note to finding one. Brain scanning technology has since been used to provide further support for their theory. If the chance of loss or gain are statistically equal, we will be more concerned with the loss. We are innately predisposed to make illogical conclusions when it comes to our own money.
The Framing Effect
This pre-disposition to focus on potential loss probably explains why we hold such high levels of cash and brings us onto the importance of understanding the ‘framing effect’ – another vital part of Kahneman’s research.
Tversky and Kahneman asked participants to decide between two treatments for individuals suffering from disease.
Total patients: 600
Treatment A – results in 400 deaths.
Treatment B – had a 33.3% chance that nobody would die and a 66.7% chance that everyone would die.
Treatment A received only 22% support
They then reframed the options for participants:
Treatment A – will save 200 lives
Treatment B –had a 33.3% chance that nobody would die and a 66.7% chance that everyone would die.
Treatment A received 77% support
Quite unbelievably, simply by changing how the options are presented, a completely different outcome is produced. So where am I going with all this? Well, the same applies for how you think about the cash in your bank account:
Option 1 – Cash and safety
Option 2 – Investment and risk
Often, due to our biological conditioning and the ‘framing effect,’ we regularly select ‘Option 1.’ We give a whole host of reasons for this choice, usually along the lines of ‘markets looking overvalued,’ ‘it feels better,’ ‘COVID’ and so on.
However, let me now ‘re-frame’ those options:
Option 1 – Guaranteed loss
Option 2 – Potential short-term loss for possible and likely long-term gain.
As we know, cash will nearly always fall in value due to your personal inflation rate and, over the longer term, a well-diversified investment portfolio is likely to go up. Framed in this way, everyone would always select Option 2. It could even seem entirely illogical to pick Option 1 in most circumstances.
Sequencing risk in drawdown – how much should you keep in cash?
However, it’s not quite that straightforward. When emotions are removed from the picture, holding cash is challenging to justify. However, emotions are an important part of investing. Regardless of the logic, if a bit of cash helps you sleep more comfortably at night, then holding onto some may be a very sensible decision.
Furthermore, the reasons for holding cash differ greatly for those building their wealth versus those in drawdown. There is strong logic behind retaining some cash when you become reliant on your investments for income, even if it does depreciate in real terms.
Sequencing risk is the risk created by the ‘sequence’ in which portfolio returns are generated (i.e. strong performing years vs poor) and in which of these years’ withdrawals are taken from the portfolio. This is best demonstrated by economist William Bengen’s research. Bengen is credited for creating the safe withdrawal rate by analysing historical returns over different asset classes. Amazingly, Bengen found that someone who retired in 1967 drawing 4.5% a year could expect their pot to last almost 50 years. However, someone who retired just a year later (on the same terms) would run out after 33 years. This is because the second investor started withdrawals during one of the largest bear markets in history. The period in which you sell down your investments can have a significant impact.
There have been 26 market corrections (losses exceeding 10%) since World War II with an average recovery period of four months. This perhaps demonstrates that recovery is likely to come quickly in most circumstances. However, there have also been 12 bear markets (losses exceeding 20%) over the same period. Many have recovered within a year, with an average recovery period of 14.5 months and all have fully recovered within two years.
Consequently, for those in drawdown, retaining cash holdings equivalent to 12-24 months of your net income provides a helpful safety net from sequencing risk. It will allow them to ride out the storm and draw from cash holdings, rather than their investments, during significant market falls. Unfortunately, though, whilst 14 months of cash would see them through nearly every bear market in history, clients in drawdown seem to ‘like’ holding significantly more than this.
Market timing
Apart from ‘feeling safer’, another common reason people tend to hold cash is a belief that ‘it’s not the right time to invest.’ So, when is the right time I wonder? Well, if the research is to be believed, the ‘right time’ for most people is usually the wrong time!
In its research report “Quantitative Analysis of Investor Behaviour,” the independent research firm Dalbar found that a typical every-day punter had underperformed their benchmark by nearly 5% over the past 30 years by mistiming moves in and out of markets. The research consistently demonstrated that the average amateur investor displayed a strong tendency to sell at just the wrong time whenever there was a lot of sudden market volatility.
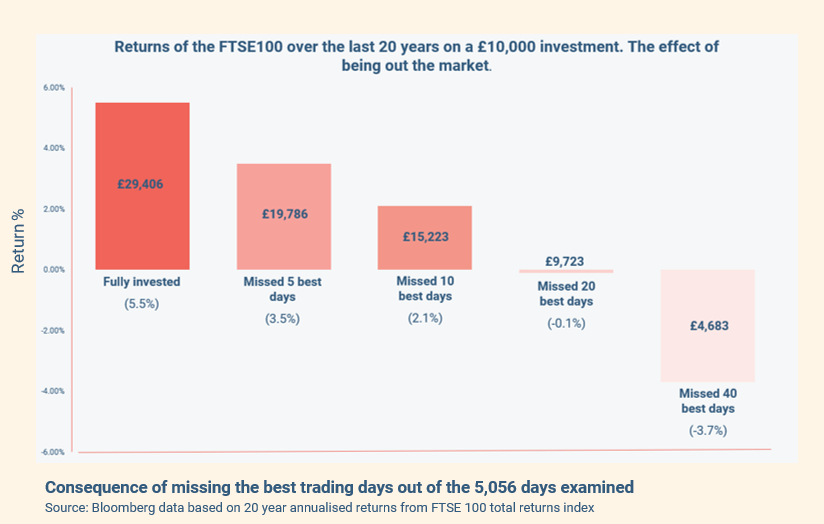
Why? It’s extremely hard to predict the future but easy to be reactive to what’s already happened: it’s easy to sell everything once you’ve watched markets tumble, but more challenging to determine when to throw your cash back into the mix before a recovery occurs. This is where that good old saying “it’s time in the market, not timing the market” comes from. This is best demonstrated by a graph:

That’s right; if you were out of the market for just 20 of the best days of 5,056 trading days, you’d have lost money compared to achieving a rather healthy return by just staying invested. Fancy your chances? Predictive market timing is rarely possible. The more common pattern is that cash holders wait for an event that they are almost guaranteed to miss. When they finally put their money back in the market, they’re usually far worse off.
It’s for this reason that the International Longevity Centre found that individuals who received financial advice were, on average, £47,000 better off in retirement than those (in the same income bracket) who didn’t. Yes, we’ll do some clever tax planning for you and have a team of highly skilled investment professionals managing your money. However, most importantly, we stop you hitting the ‘red button’ and acting on emotionally-driven decisions that will ultimately hit you in the pocket.
Bringing this all together
There’s no doubt that, if individuals were able to see the thousands of pounds they were losing to inflation every month, their approach to cash would be markedly different. If we were chemically wired differently, I suspect we’d find very few people holding much cash at all. So, what message am I leaving you with? No, not that cash is always bad. Hopefully, I’ve made it clear that emotions are at play here and cash can also be useful to those in drawdown. However, what is important is that you have a strong understanding of the cost of the decisions you are making. If you have decided to sit on cash and wait for the ‘right’ time, you should know that purposely achieving this is highly unlikely. In fact, in most circumstances, by choosing to hold cash, you are choosing to lose money. As discussed, this decision can be justified but please don’t just leave cash sat there because it ‘feels’ like the right thing to do. Apathy or simply an ill-informed belief about cash could be costing you huge sums of money and you might not even realise it…
Do you need help managing your investments?
Our team can recommend an investment strategy to meet your financial objectives and give you peace of mind that your investments are in good hands. Get in touch to discuss how we can help you.

Article sources
Editorial policy
All authors have considerable industry expertise and specific knowledge on any given topic. All pieces are reviewed by an additional qualified financial specialist to ensure objectivity and accuracy to the best of our ability. All reviewer’s qualifications are from leading industry bodies. Where possible we use primary sources to support our work. These can include white papers, government sources and data, original reports and interviews or articles from other industry experts. We also reference research from other reputable financial planning and investment management firms where appropriate.
The views expressed in this article are those of the Saltus Asset Management team. These typically relate to the core Saltus portfolios. We aim to implement our views across all Saltus strategies, but we must work within each portfolio’s specific objectives and restrictions. This means our views can be implemented more comprehensively in some mandates than others. If your funds are not within a Saltus portfolio and you would like more information, please get in touch with your adviser. Saltus Asset Management is a trading name of Saltus Partners LLP which is authorised and regulated by the Financial Conduct Authority. Information is correct to the best of our understanding as at the date of publication. Nothing within this content is intended as, or can be relied upon, as financial advice. Capital is at risk. You may get back less than you invested. Tax rules may change and the value of tax reliefs depends on your individual circumstances.
About Saltus?
Find out more about our award-winning wealth management services…
Winner
Investment Performance: Cautious Portfolios
Winner
Top 100 Fund Selectors 2024
Winner
Best Places to Work 2024
Winner
Best Financial Advisers to Work For
£8bn+
assets under advice
20
years working with clients
350+
employees
97%
client retention rate


