Active
adjective
ac·tive | \ ˈak-tiv
Used to emphasise that someone is taking action in order to achieve something, rather than just hoping for it or achieving it in an indirect way.
Passive
adjective
pas·sive | \ ˈpa-siv
Accepting or allowing what happens or what others do, without active response or resistance.
The debate surrounding active versus passive investing has been raging for several decades and remains one of the more divisive issues in the investment industry. Each side of the argument has plenty of evidence to cite for its superiority, and when formulating an investment strategy, it is a consideration that investors cannot ignore.
Recent punditry has been quick to write off active management, given the strong performance of the past few years of some passive instruments. However, just because one style of investing has come into favour, it does not necessarily mean it is superior. Recency bias is the tendency to believe that more recently observed patterns will continue. Investors who only consider recent past performance might be missing the wood for the trees.
In basic terms, defining active or passive investing is straightforward: active investors attempt to outperform the returns of a specific benchmark, whereas passive investors accept the market return by tracking a specific market index. The positives and negatives of this simplistic view are easy to represent:
The case for active management:
- The opportunity to outperform the market
- Flexibility is inherent so that the fund can be closely tied to the investor’s objectives
- Risk management is built-in through this flexibility (ability to avoid sectors/regions/styles)
The case against active management:
- Performance depends on the ‘skill’ of the manager
- Higher costs lead to a lower probability of outperformance(Vanguard, n.d.)
- Key person risks
The case for passive management:
- Management fees are low with passive managers, giving a higher chance of performance
- You get the outcome you expect: the return of the market you are tracking (plus or minus a small tracking error)
- No key person risks
The case against passive management:
- No chance of outperformance
- Index tracking doesn’t pay attention to fundamentals, valuations, or the stage in the company’s growth cycle
- Investors in passive instruments can be herded into overbought asset classes/sectors
- Asset allocation can’t be passive
In practice, this is made harder by the final point, that asset allocation can’t be passive. Someone must decide the mix of assets: what investments do you want to passively track exactly? Do you want to track one market or several? If more than one, how much are you putting into each, and when do you rebalance the portfolio? Adjusting a portfolio to an investor’s objective is key to reaching financial goals, and by investing into anything from cash, an active decision must be made. The route you go down when selecting the investments is the tough choice, but by using a robust, rigorous, and repeatable approach to both portfolio construction and fund selection you can mitigate some of the challenges.
Do you need help managing your investments?
Our team can recommend an investment strategy to meet your financial objectives and give you peace of mind that your investments are in good hands. Get in touch to discuss how we can help you.

Looking back and looking forward
Focusing on the strength of the previous decade in passive investing, in only one calendar year did active managers outperform passive investments in the largest Morningstar category (Morningstar Large Blend US Equities which has $3.5tn invested). Supposedly this is the most efficient area of the market due to the masses of information available – so active management here would make the least sense. However, as is the case for most investing, styles can be cyclical: between 2000 and 2009, active managers in this sector outperformed nine out of ten times (Hartford Funds, n.d.).
What does this cyclicality in active and passive performance mean for the investor? It demonstrates that maintaining perspective over time is key and minimising the exposure to market sentiment as market cycles change helps achieve this. This specifically speaks to one’s investment goals and preventing oneself from being enchanted by recent performance. Instead, an investor should look to see what the future could hold. The Coronavirus crisis brought a very sharp drawdown in equity markets followed by an equally sharp rebound which resulted in little separation between active and passive styles. However, more recently as inflation begins to bite and economies start to groan, active strategies are holding up well as they have been able to tilt away from bond exposure in particular. Over the past 35 years, active managers have outperformed passive managers 70% of the time during a correction (measured by a loss of 10% or greater) within the same Morningstar category. This has given an average outperformance of 1.72%, which is attributed to the ability of managers to mitigate risk and reduce exposure to stocks or sectors with poor fundamentals and inflated valuations.
Going further back, when the treasury yield quadrupled from 3.85% to 15.8% from 1962 to 1981 (Mezrich), the median return for US Large Company mutual funds was 62% better than the index. Within a rising rate environment, (such as 2013 during the taper tantrum) active managers appear to do well. Theoretically, this is due to the dispersion between the best and worst-performing stocks increasing during a rising rate environment giving more opportunities for stock selection.
Looking forward, we can see that the current environment for stock picking is favourable, given interest rates are rising (among other structural changes such as high inflation and heightened geopolitical risks). Additionally, from further research in academic studies, there seem to be four components that determine the ‘Active Equity Opportunity’ (Thomas Howard, n.d.). This estimates the impact of market conditions on returns by measuring the distribution and skewness of individual stocks.
- Individual stock standard deviation (the dispersion of individual stocks within an index)
- Individual stock skewness (the idea that the distribution of returns has the tail on the right side – more chance of large upside movements than large downside movements)
- Overall volatility of the index
- Expected small company returns versus large company returns
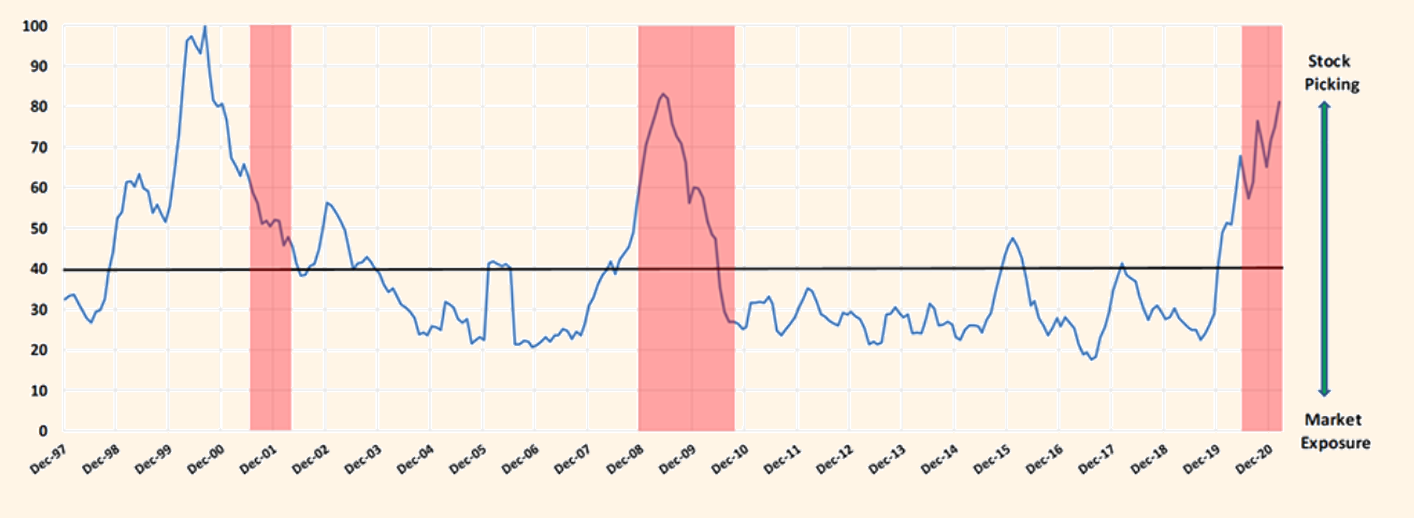
Figure 1 – (Thomas Howard, n.d.)
Utilising these inputs, a calculated score can be achieved, and over the past 25 years, the average score has been 40 (out of 100) as shown in Figure 1. The recent decade has reached an all-time low of 18 (mid-2017) and remained consistently below average. This is until very recently, where this trend has reversed throughout the Covid crisis, and the score has reached twice its average. Active investors prefer a higher score since it indicates that the higher conviction ideas are more likely to outperform. Whether we are in a new, sustained paradigm is a harder question to answer. The empirical data, however, points to a period that active managers should thrive in.
Does size really matter?
When comparing most active fund managers, it is important to view them relative to a benchmark. This allows you to analyse whether you would have been better off buying a passive fund with the same exposure, or whether the manager has had quantifiable skill over the same period. The areas in which active managers have traditionally outperformed is within the small capitalization stock market. This is due to the fact that smaller companies are typically less well known, less researched and often have significant upside growth potential versus their larger peers. This gives greater sources of alpha, as the market is less efficient in pricing these companies and their future growth.
Looking at two markets in particular, the US large cap equity market (as represented by the S&P 500 – the 500 largest listed companies listed in the US) and the UK small cap market (represented by the FTSE small cap ex Investment Trust index – the smallest companies listed on the London Stock Exchange) there are significant disparities between the average managers (using the Investment Association sectors).
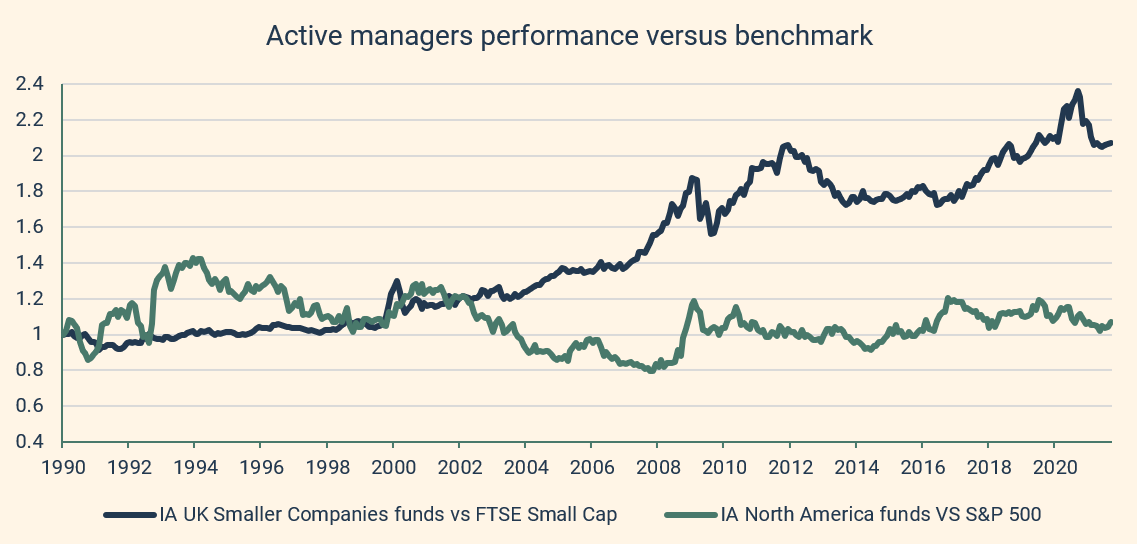
Figure 2 – Source FE Analytics
Looking at Figure 2 we can see that since 1990 the average US equity manager (using the IA North American sector) has performed in line with the benchmark, with the relative performance staying at 1. However, UK small cap managers over the same period made twice the return of their benchmark. Whilst there are periods where holding an active manager in either would have been beneficial, looking over the long term the average US equity manager is truly average. This is further shown by looking at rolling returns (taking annualised five year returns throughout time).
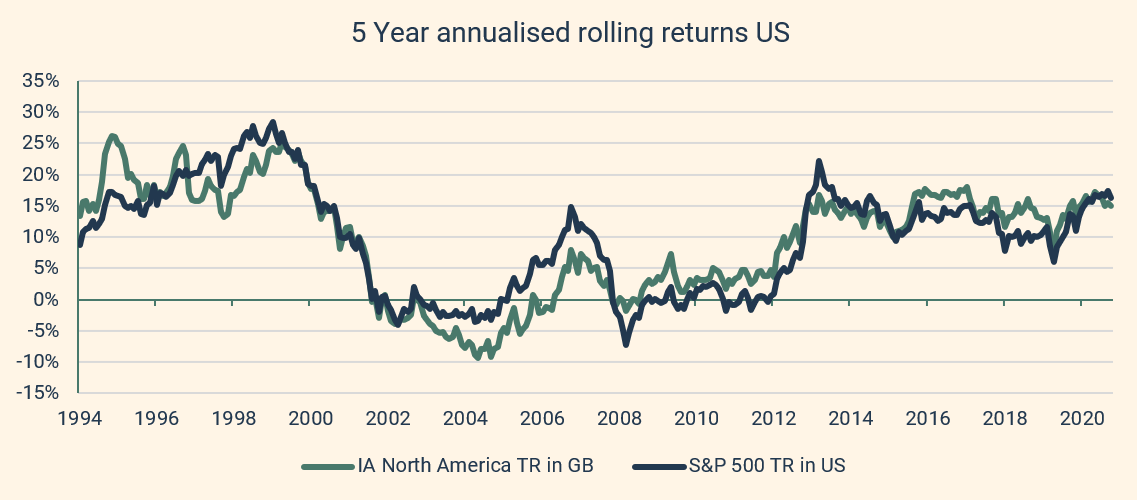
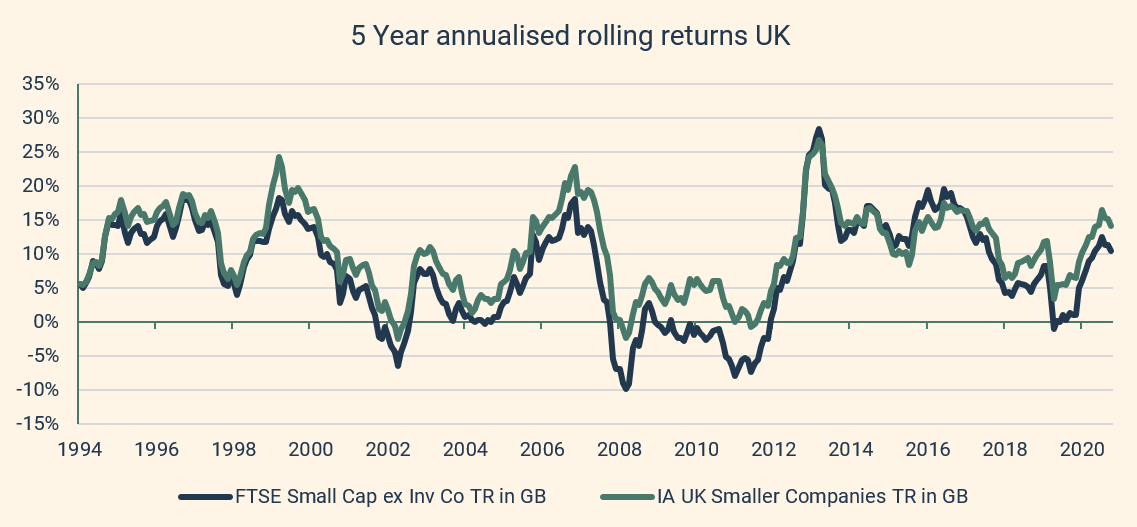
Figure 3 and 4 – Source FE Analytics
Figures 3 and 4 show the rolling five-year performance of both the average manager in the US and UK smaller company sectors and their respective benchmarks. When the manager is above the benchmark, it represents the performance over the prior five years being higher. You can see that consistently the UK smaller companies managers have outperformed on a rolling basis (88.8% of the time) whereas in the US the average manager is far closer to average (52.8% of the time). Therefore, when constructing a portfolio, it might make sense to utilise a blend of passive managers to get exposure to the larger segments of the market, whilst employing managers who can add alpha within the small cap end of the market.
This analysis takes fees into account for the active managers. However, there isn’t a fee attached to the index, and in order to get exposure you pay for the implementation of this. If we assume a fee of 0.15% on the passive index, this increased the chances of the US active manager outperforming over rolling five-year periods to 54%.
So, what is the right approach?
The focus thus far has been purely performance-related, and specifically within equities. The argument changes slightly when you take into account investors with other goals rather than just maximum return. This particularly applies when considering risk tolerances. Typically to reduce risk, you increase the diversification of a portfolio by increasing weightings to lower-risk investments, such as cash, fixed income, or alternatives at the expense of equities. Within these markets, passive investing is a separate subject, as the availability of indices varies. Specifically, within fixed income, a market-weighted index might not make the most sense (ie the most indebted countries/companies have a higher weighting) from a risk and return perspective. A significant majority of alternatives are also simply not available in passive form – Private Equity for example.
The rise of being an active shareholder as well as an active investor is also extremely pertinent. As an investment manager, we have a fiduciary commitment to our clients, and when we utilise active managers, they have the ability to vote within their stocks to cause change and actively engage with management. This is an important consideration with the rise of Environmental, Society and Governance (ESG) factors within the investment universe. A passive investment is unlikely to be suitable for a client with ethical considerations due to passive managers being unable to engage and push for positive change.
The evidence suggests that active managers consistently outperform in specific marketplaces, whilst passive instruments are superior in others. Similarly, in falling markets passive instruments can really struggle, whilst passives can do well in environments driven by positive sentiment. Given this, it’s really about ensuring you have the ability to select the correct active managers operating in the right areas of market. We use both quantitative and qualitative analysis to differentiate genuinely skilful managers from those who deliver average or below average performance. If exceptional managers cannot be identified and the exposure to the underlying asset is still desirable, then passive funds should be used to implement the decision.
At Saltus, we believe this approach is more holistic in nature and reflects the ability for an active manager to outperform, whilst maintaining access to the cheap market ‘beta’ through passives when appropriate. This blended approach favours active management but allows us to capture the best of both worlds, by being selective with our active manager choice in areas where we believe they can access alpha. This alpha could be made from the outperformance over the benchmark, or making superior risk adjusted returns to diversify a portfolio. There is space for passive managers as a tool to use when constructing a portfolio but, looking forward, given the changing investment conditions, it could be the time for active managers to have their day in the sun.
Bibliography
DV Ratings. (n.d.). Retrieved from https://www.advratings.com/top-asset-management-firms
Bloomberg. (n.d.). Retrieved from https://www.bloomberg.com/news/articles/2019-09-11/passive-u-s-equity-funds-eclipse-active-in-epic-industry-shift
Bogle, J. (n.d.). Retrieved from https://www.etf.com/publications/journalofindexes/joi-articles/11136-the-economic-role-of-the-investment-company.html?nopaging=1
Eugene Fama, K. F. (n.d.). Retrieved from https://www.sciencedirect.com/science/article/abs/pii/0304405X93900235?via%3Dihub
Mezrich, J. (n.d.). Nomura Securities.
MFS Investment Managment. (n.d.). Retrieved from https://en.wikipedia.org/wiki/MFS_Investment_Management
Moneyweek. (2015, 05 26). Retrieved from https://moneyweek.com/392888/26-may-1896-charles-dow-launches-the-dow-jones-industrial-average/
Thomas Howard, J. V. (n.d.). Retrieved from https://blogs.cfainstitute.org/investor/2021/04/15/active-equity-reports-of-my-death-are-greatly-exaggerated/
Do you need help managing your investments?
Our team can recommend an investment strategy to meet your financial objectives and give you peace of mind that your investments are in good hands. Get in touch to discuss how we can help you.

Article sources
Editorial policy
All authors have considerable industry expertise and specific knowledge on any given topic. All pieces are reviewed by an additional qualified financial specialist to ensure objectivity and accuracy to the best of our ability. All reviewer’s qualifications are from leading industry bodies. Where possible we use primary sources to support our work. These can include white papers, government sources and data, original reports and interviews or articles from other industry experts. We also reference research from other reputable financial planning and investment management firms where appropriate.
The views expressed in this article are those of the Saltus Asset Management team. These typically relate to the core Saltus portfolios. We aim to implement our views across all Saltus strategies, but we must work within each portfolio’s specific objectives and restrictions. This means our views can be implemented more comprehensively in some mandates than others. If your funds are not within a Saltus portfolio and you would like more information, please get in touch with your adviser. Saltus Asset Management is a trading name of Saltus Partners LLP which is authorised and regulated by the Financial Conduct Authority. Information is correct to the best of our understanding as at the date of publication. Nothing within this content is intended as, or can be relied upon, as financial advice. Capital is at risk. You may get back less than you invested. Tax rules may change and the value of tax reliefs depends on your individual circumstances.
Related blog posts
About Saltus?
Find out more about our award-winning wealth management services…
Winner
Best Wealth Manager
Winner
Investment Performance: Cautious Portfolios
Winner
Top 100 Fund Selectors 2024
Winner
Best Places to Work 2024
£8bn+
assets under advice
20
years working with clients
350+
employees
97%
client retention rate

