Introduction
The bond market is huge, complex, and extremely important. Bonds are often viewed as the safest part of investment portfolios, relied on to provide protection when trouble arises. However, this year has been the worst start to a year for bonds in decades, with many of these “safe” investments down over 20% this year. So, what is going on with bonds, and what are Saltus doing about it?
Background
First, a quick explainer on bonds for those unfamiliar, feel free to skip this section if you know all about them!
Bonds are a way for governments or companies (“issuers”) to borrow money, and they’ve been used for a very long time. The first known bond dates from around 2,400BC in Mesopotamia. In these times, people generally borrowed cattle or grain. The borrowed herd or crop would grow over time, allowing interest to be paid to the lender in the form of more cattle or crop. The agreement typically etched onto a stone.
Finance has moved on a lot since then, but the essential nature of a bond remains the same. Someone with capital wants to make a return (more money generally being preferred to more cattle these days!) and is willing to lend their capital to another party. They expect their money to be returned in the future, normally at a set date (“maturity”), plus interest which is either paid periodically (via a “coupon”) or rolled up at the end. The borrower issues a bond recording the coupon, loan amount, and maturity date, which the lender holds onto, and which provides the pre-agreed payments. The right to receive the interest and capital (“the bond”) can normally be sold onto someone else, so once issued, the market price of the bond fluctuates based on various factors.
The more creditworthy the borrower, the lower the coupon payment. Additionally, the longer the loan period (time to maturity) the more the lender will want to be compensated for foregoing the use of their capital, and the higher the coupon will typically be.
Unlike stocks, traditional bonds don’t give you a stake in the issuer, so you don’t gain or lose from future company profits. So, in the absence of default, both the borrower and lender know in advance what the payment schedule will look like, since the payments are fixed, hence the other name for bonds “fixed interest”. This is why investors like them, especially those with predetermined obligations like pension funds who will seek to match their pension pay-outs with coupons received from bond investments.
However, because the payments are fixed once the loan has been agreed, this creates an additional risk. If you lend money to an issuer with a pre-agreed coupon (fixed payments), and then market interest rates increase – because a central bank has raised interest rates to temper inflation for example – when that same issuer borrows more money in future, that new loan will have higher coupons than the bonds you hold (the new bonds come with larger fixed payments). Because of this, the older bond you hold will be less valuable and so its market price will fall. If you look at the new ‘effective’ interest rate on your original bond (the fixed coupon you receive divided by the new lower price), it will be higher, but you’ll still be receiving the same lower coupon rate because it’s fixed, and your bond will have fallen in value. Its value should rise again in time, nearer to when the bond matures, but in the meantime your investment has fallen in value. This is why bond prices fall when interest rates rise (all else equal). The longer the maturity of the bond, the more sensitive the bond is to changes in interest rates, so longer dated bonds typically fall further than shorter dated bonds for a given rise in interest rates.
Other reasons market prices of bonds can fall are when people are more concerned about the ability of issuers to afford the payment schedules, for example when there are fears of recession, and also when inflation is high, because each of the fixed bond payments is worth less when inflation is high. For this reason, some bonds have payment schedules that are tied to a measure of inflation, as is the case with some bonds issued by governments, such as Inflation Linked Gilts in the UK.
Bonds are a very popular way of raising capital. In fact, the total value of all the outstanding bonds in the world exceeds the size of all the world’s equity markets combined.
Do you need help managing your investments?
Our team can recommend an investment strategy to meet your financial objectives and give you peace of mind that your investments are in good hands. Get in touch to discuss how we can help you.

What has happened this year?
2022 has been very difficult for most investors as markets have adjusted to the prospect of higher inflation, interest rates and unemployment, and lower economic growth and corporate earnings.
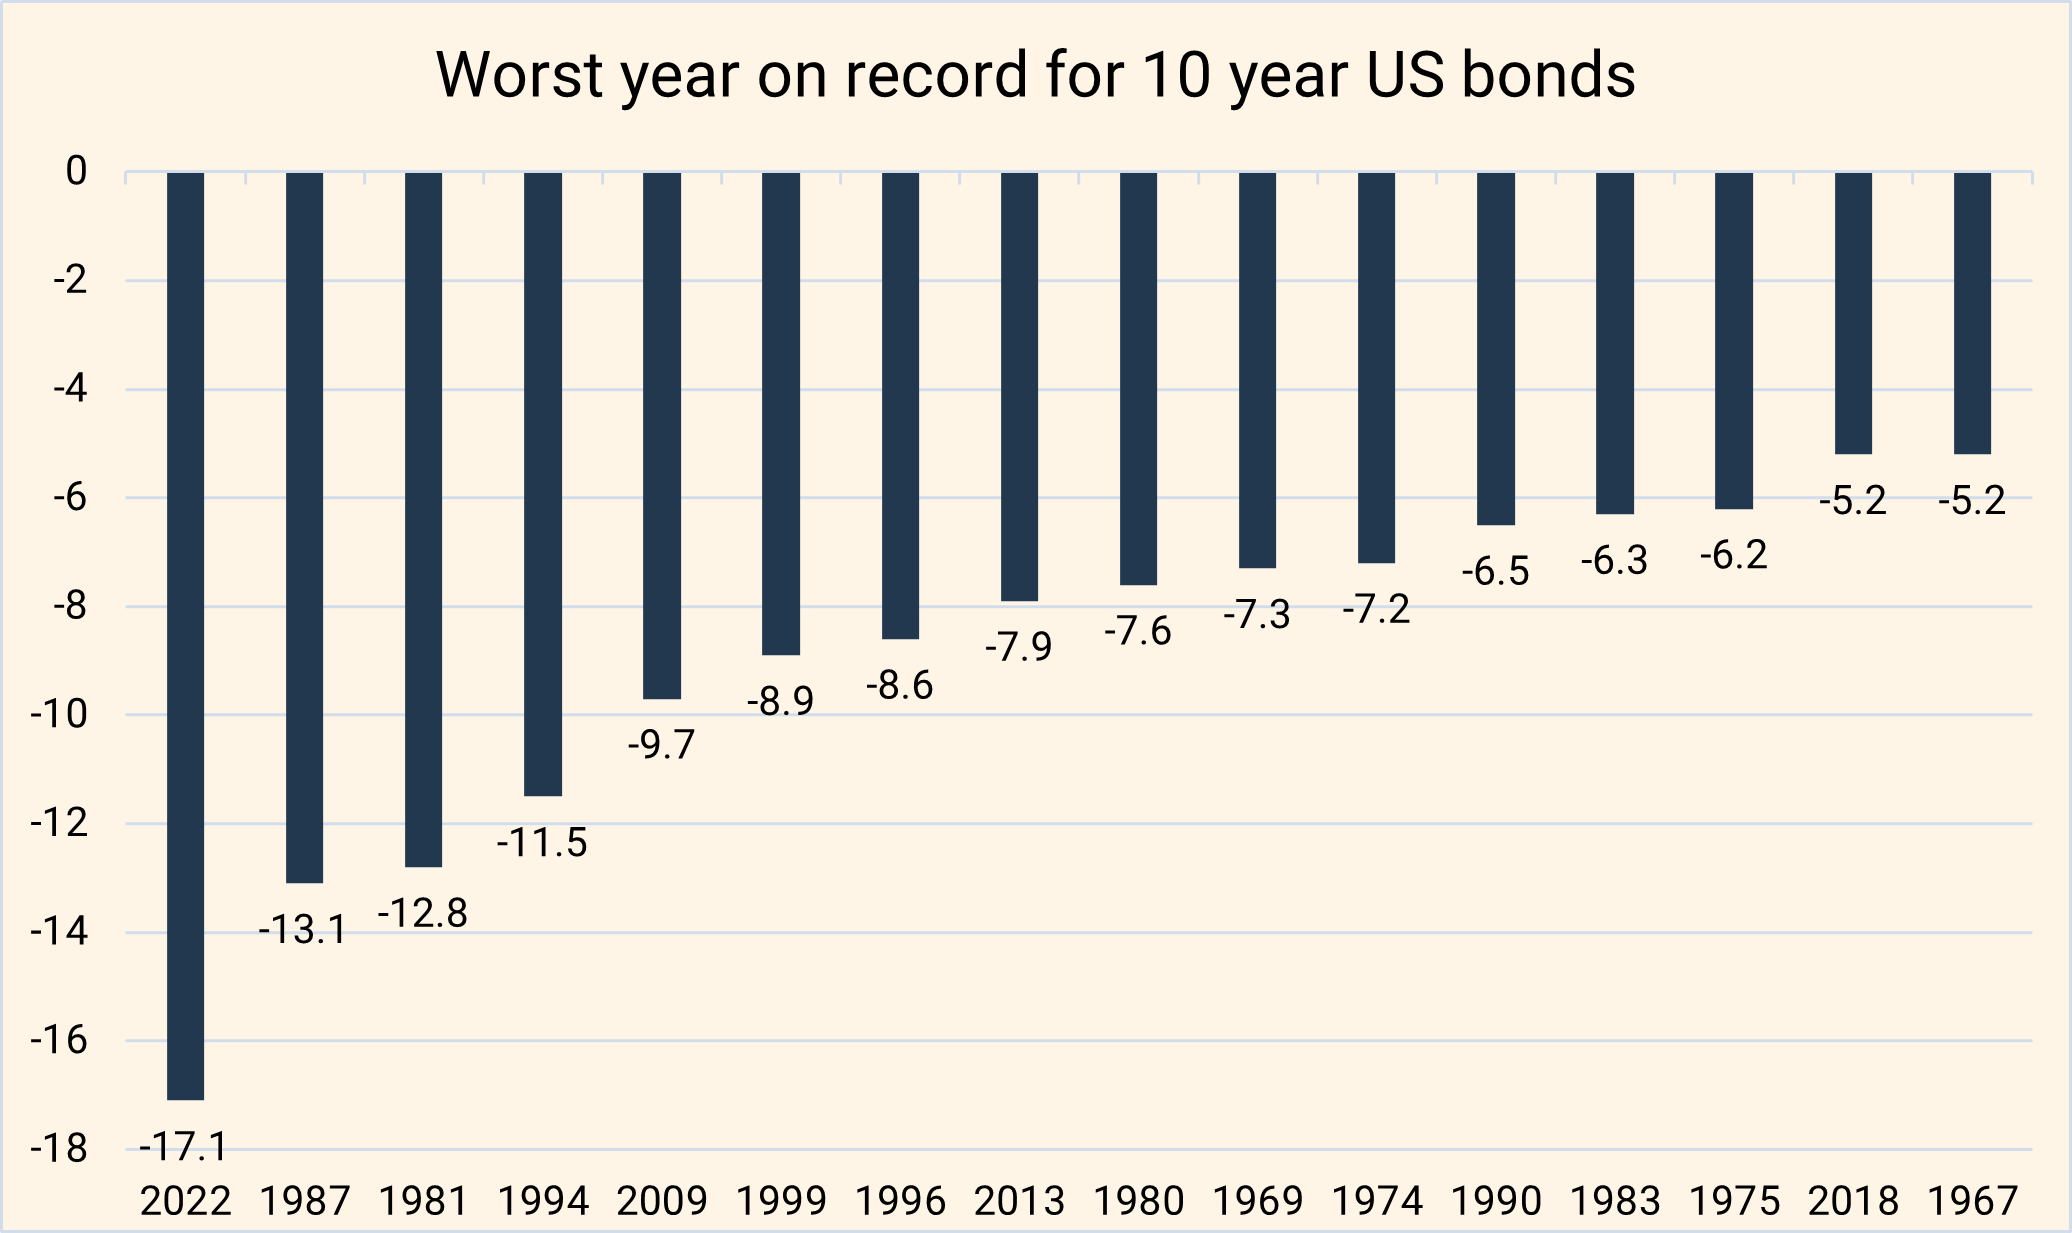
Within US government bond funds, there have been large-scale withdrawals amounting to a combined $100bn. It’s been the worst year on record for ten-year US government bonds as shown below. Despite this, for pound investors like most of our clients, returns on US bonds have generally been positive because the dollar has risen roughly 20% against the pound this year.
UK government bonds are having an even worse year. Before the mini-budget UK gilts were down over 20% and inflation linked gilts down about 30%. The market moved violently post mini-budget, with aggressive falls in gilt prices (with aggressive rises in gilt yields).
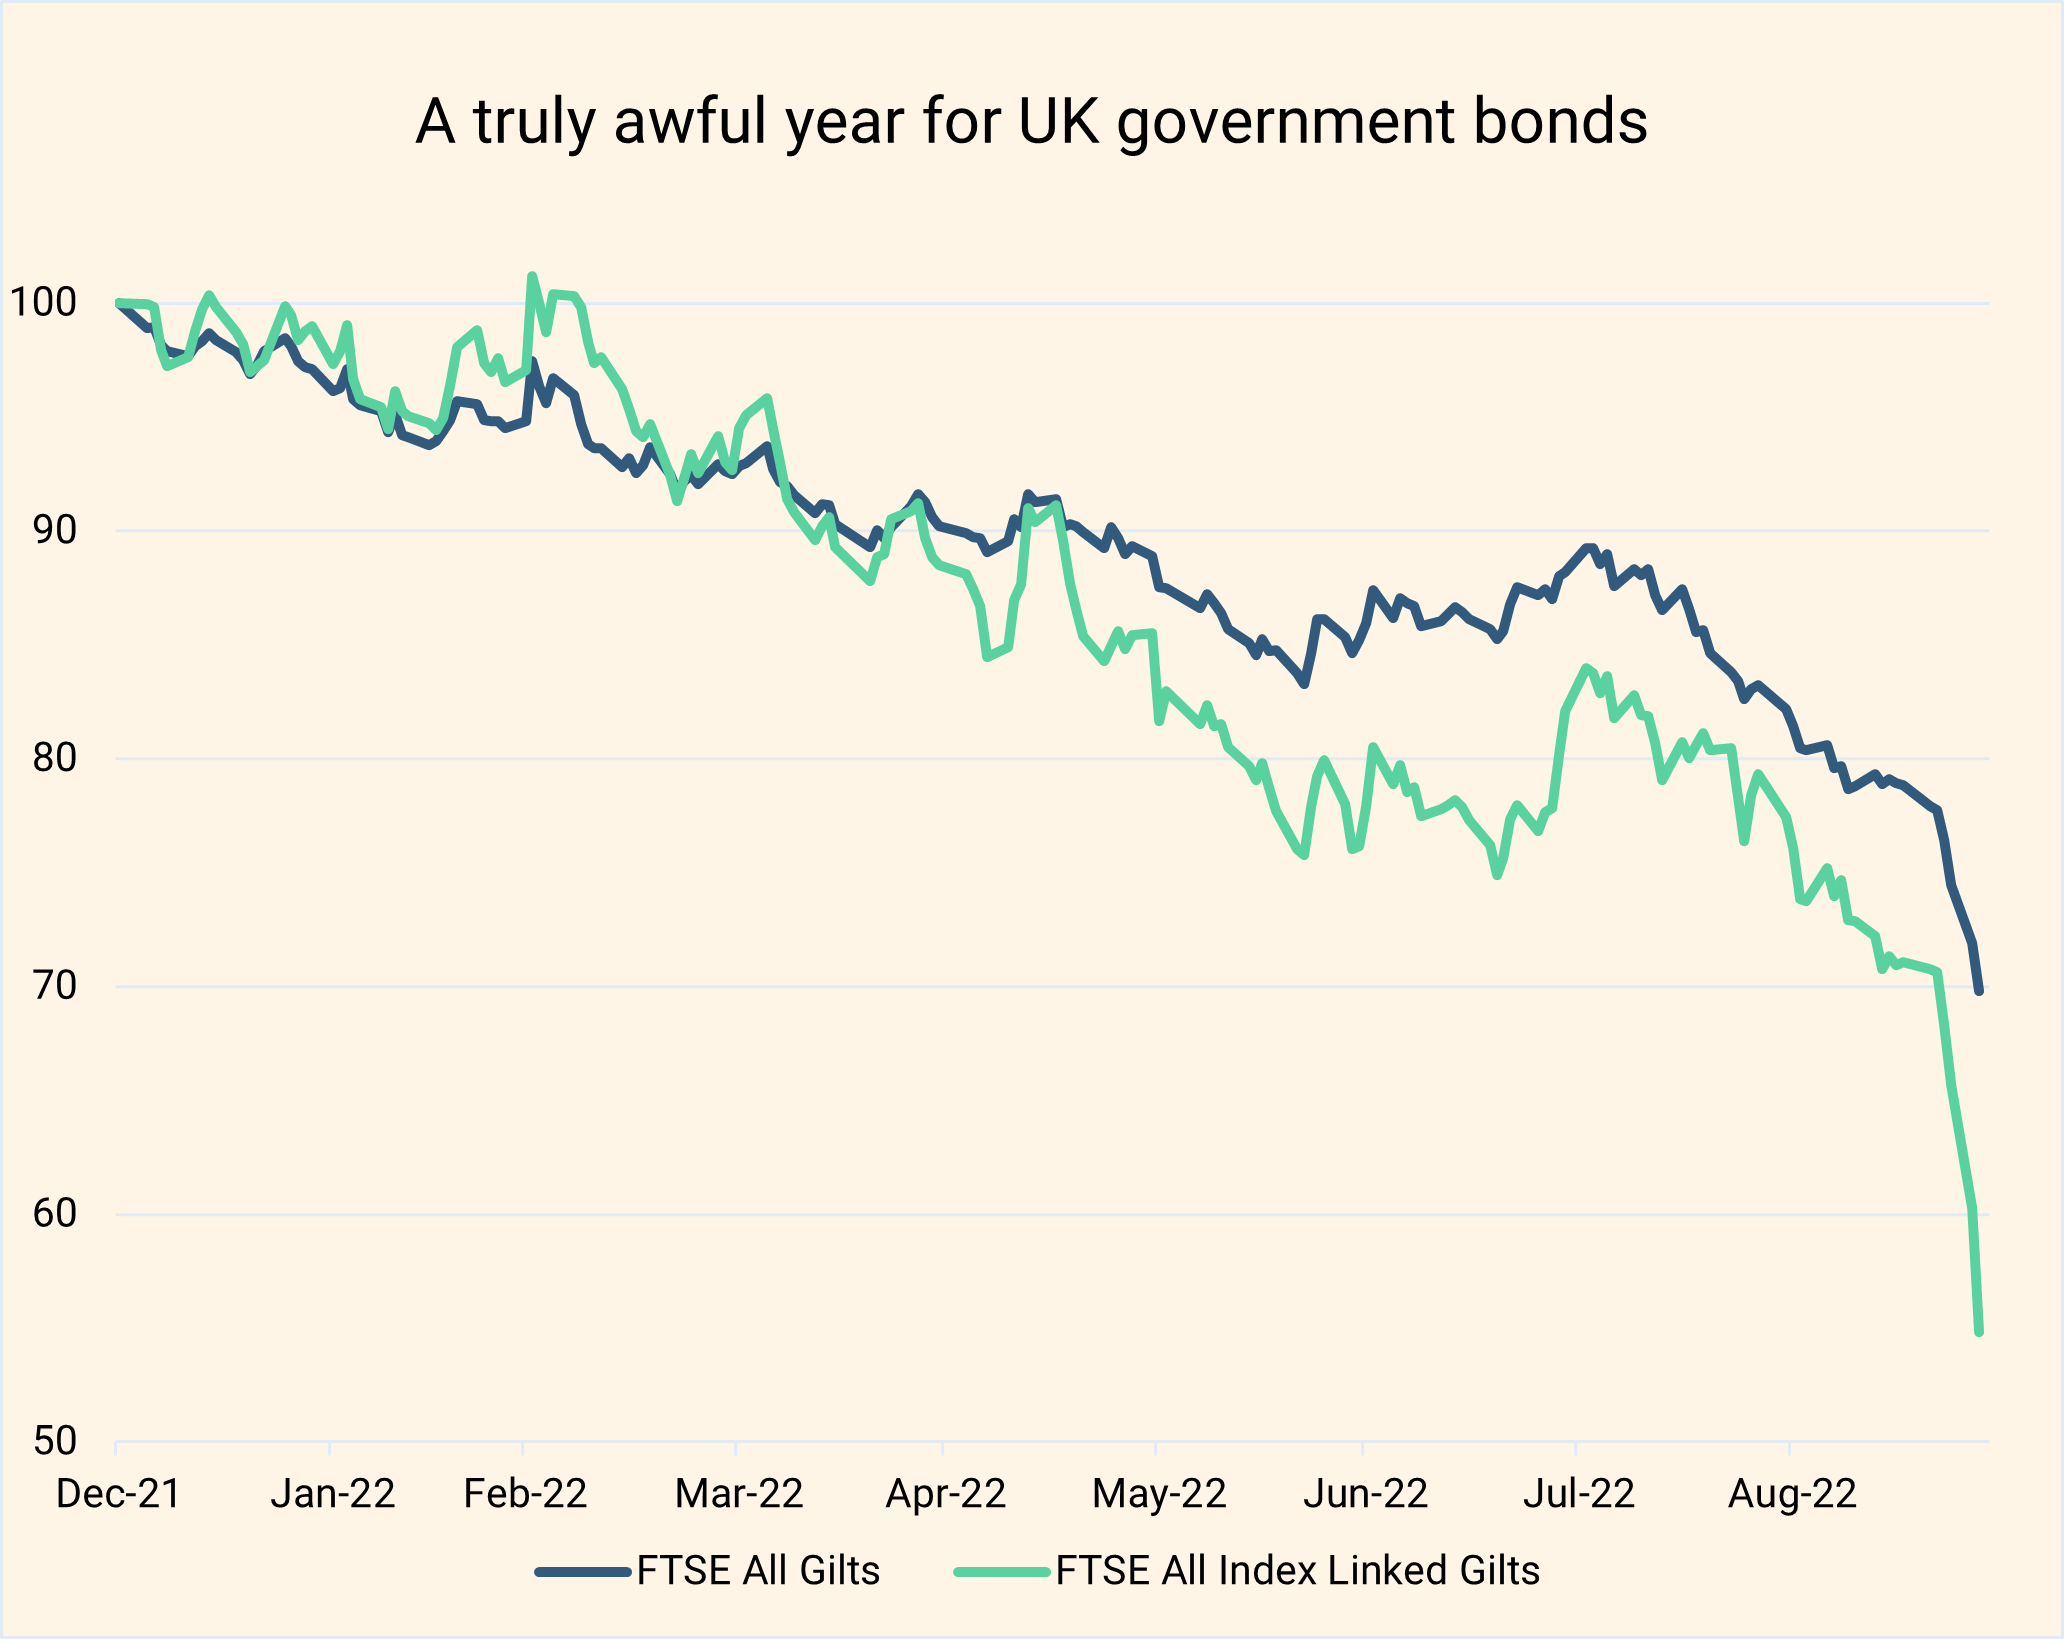
You may be wondering why inflation linked bonds are down when inflation is up (as shown above). Most of the time index-linked bonds move in a similar way to non-index-linked bonds. Because index-linked bonds typically have a long maturity, they are very sensitive to changes in interest rates.
The below chart captures more of the drama following the UK’s mini-budget. The red lines show the % change in yield over rolling five-day periods. UK gilt yields have just had their most dramatic increase since the beginning of the data series.
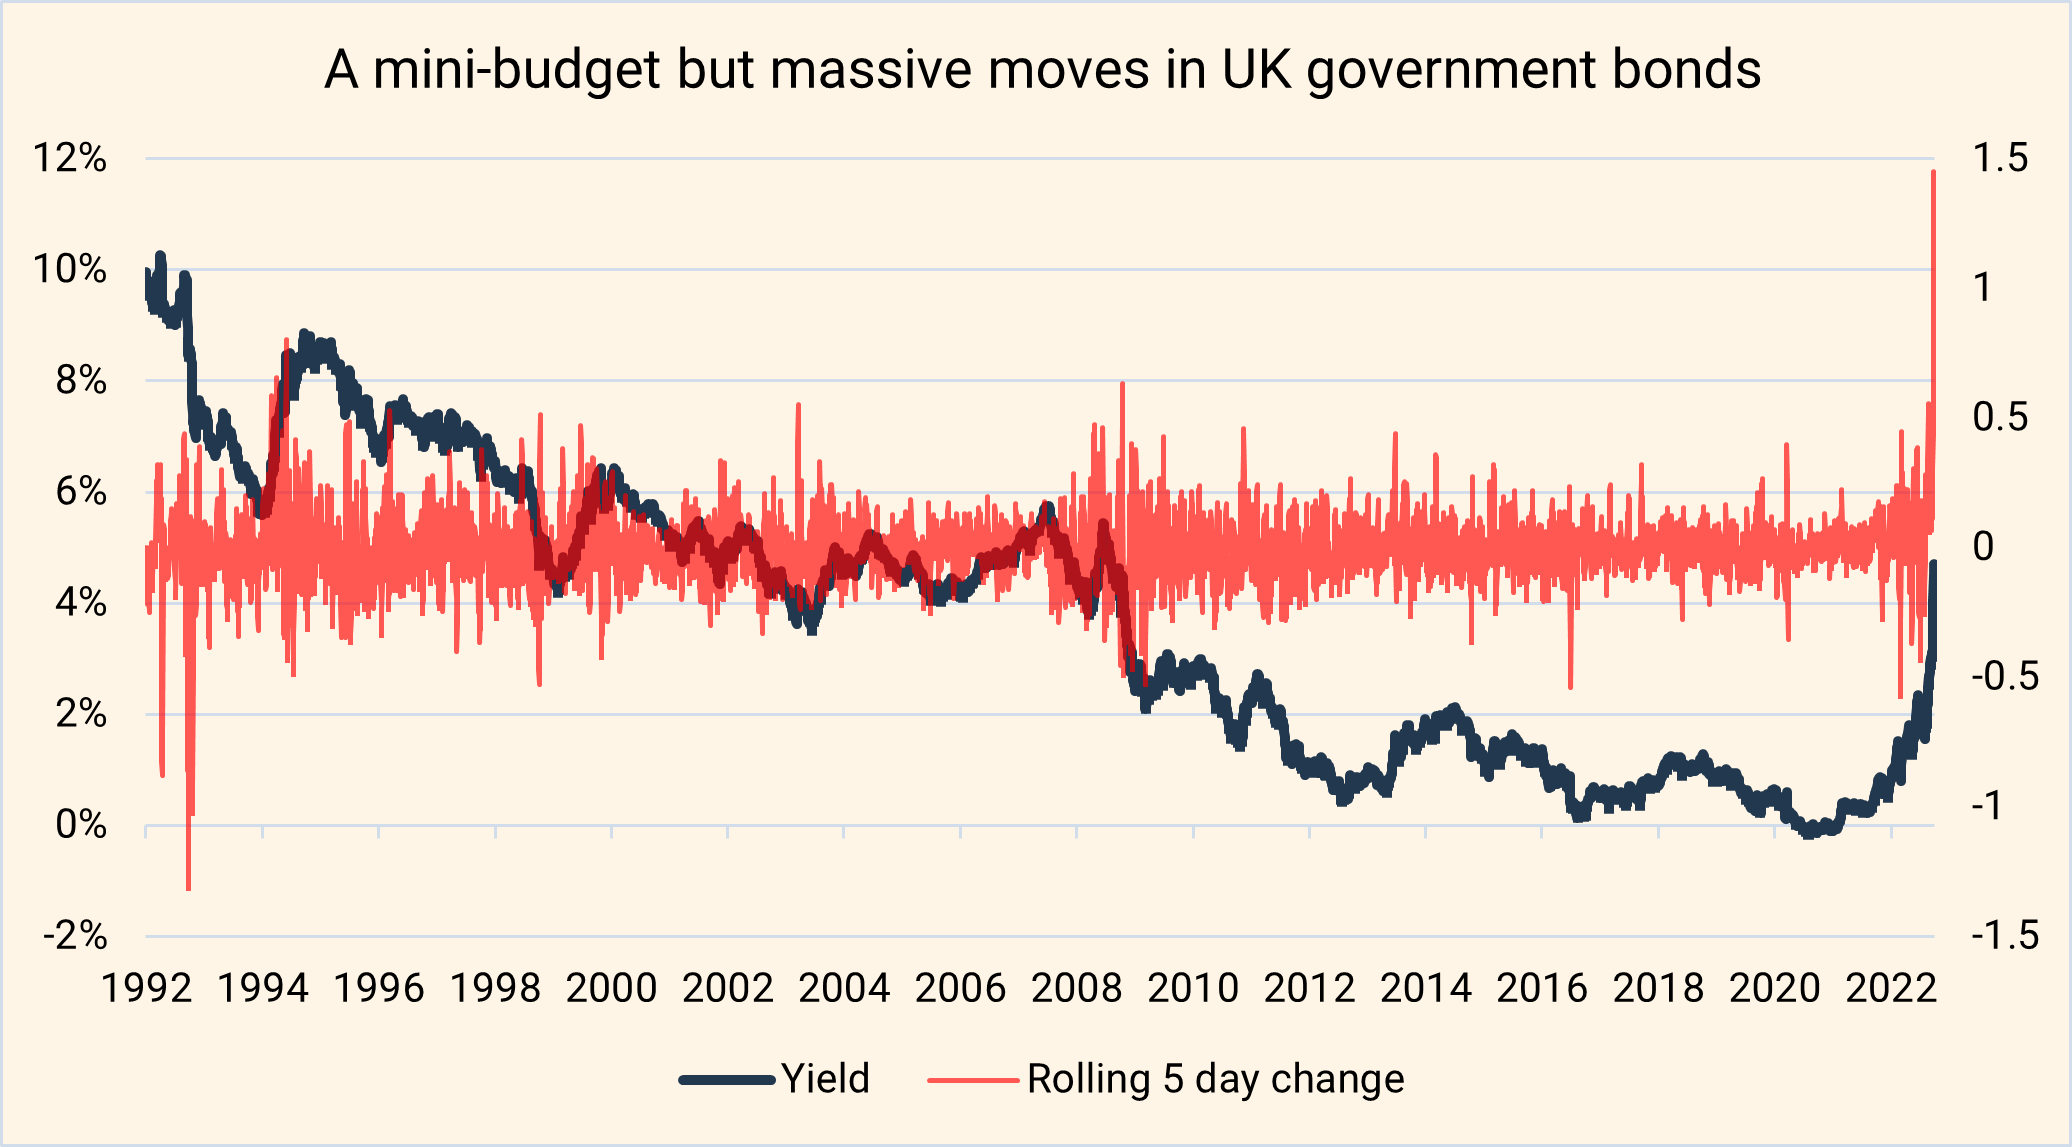
This is because the fiscal boost adds to inflationary pressure, and also the amount of debt owed by the UK government. So the Bank of England may need to raise rates even higher and even faster than before the mini-budget, so the market has now priced this in. The market is demanding higher interest rates to compensate for the weaker pound, higher inflation, and higher central bank interest rate. The chart also shows how the yield on UK five-year government bonds has steadily fallen since the 90s, before suddenly bouncing upwards this year (as the yield rises, the price falls and investors lose money), resulting in heavy losses for investors holding UK government bonds in a portfolio.
How has this affected Saltus portfolios?
Our analysis shows that many of our competitors have been using UK government bonds to protect portfolios, which has led to some large losses for low to medium risk portfolios. Thankfully, Saltus are unconstrained investors without a home bias, and we were alive to the fact that UK bonds weren’t as safe as others.
Where investor mandates allow us to express our views, we’ve had very close to no exposure to UK government bonds for some time. We have had exposure to some US government bonds, which we did mostly to increase our exposure to the dollar and has generally been positive for portfolios given the falls in the pound versus the dollar.
What is the bond market telling us?
The bond market is behaving rationally, adjusting to materially higher inflation and interest rates, and deteriorating economic growth (increased risk of recession and company defaults).
Yield curve inversion
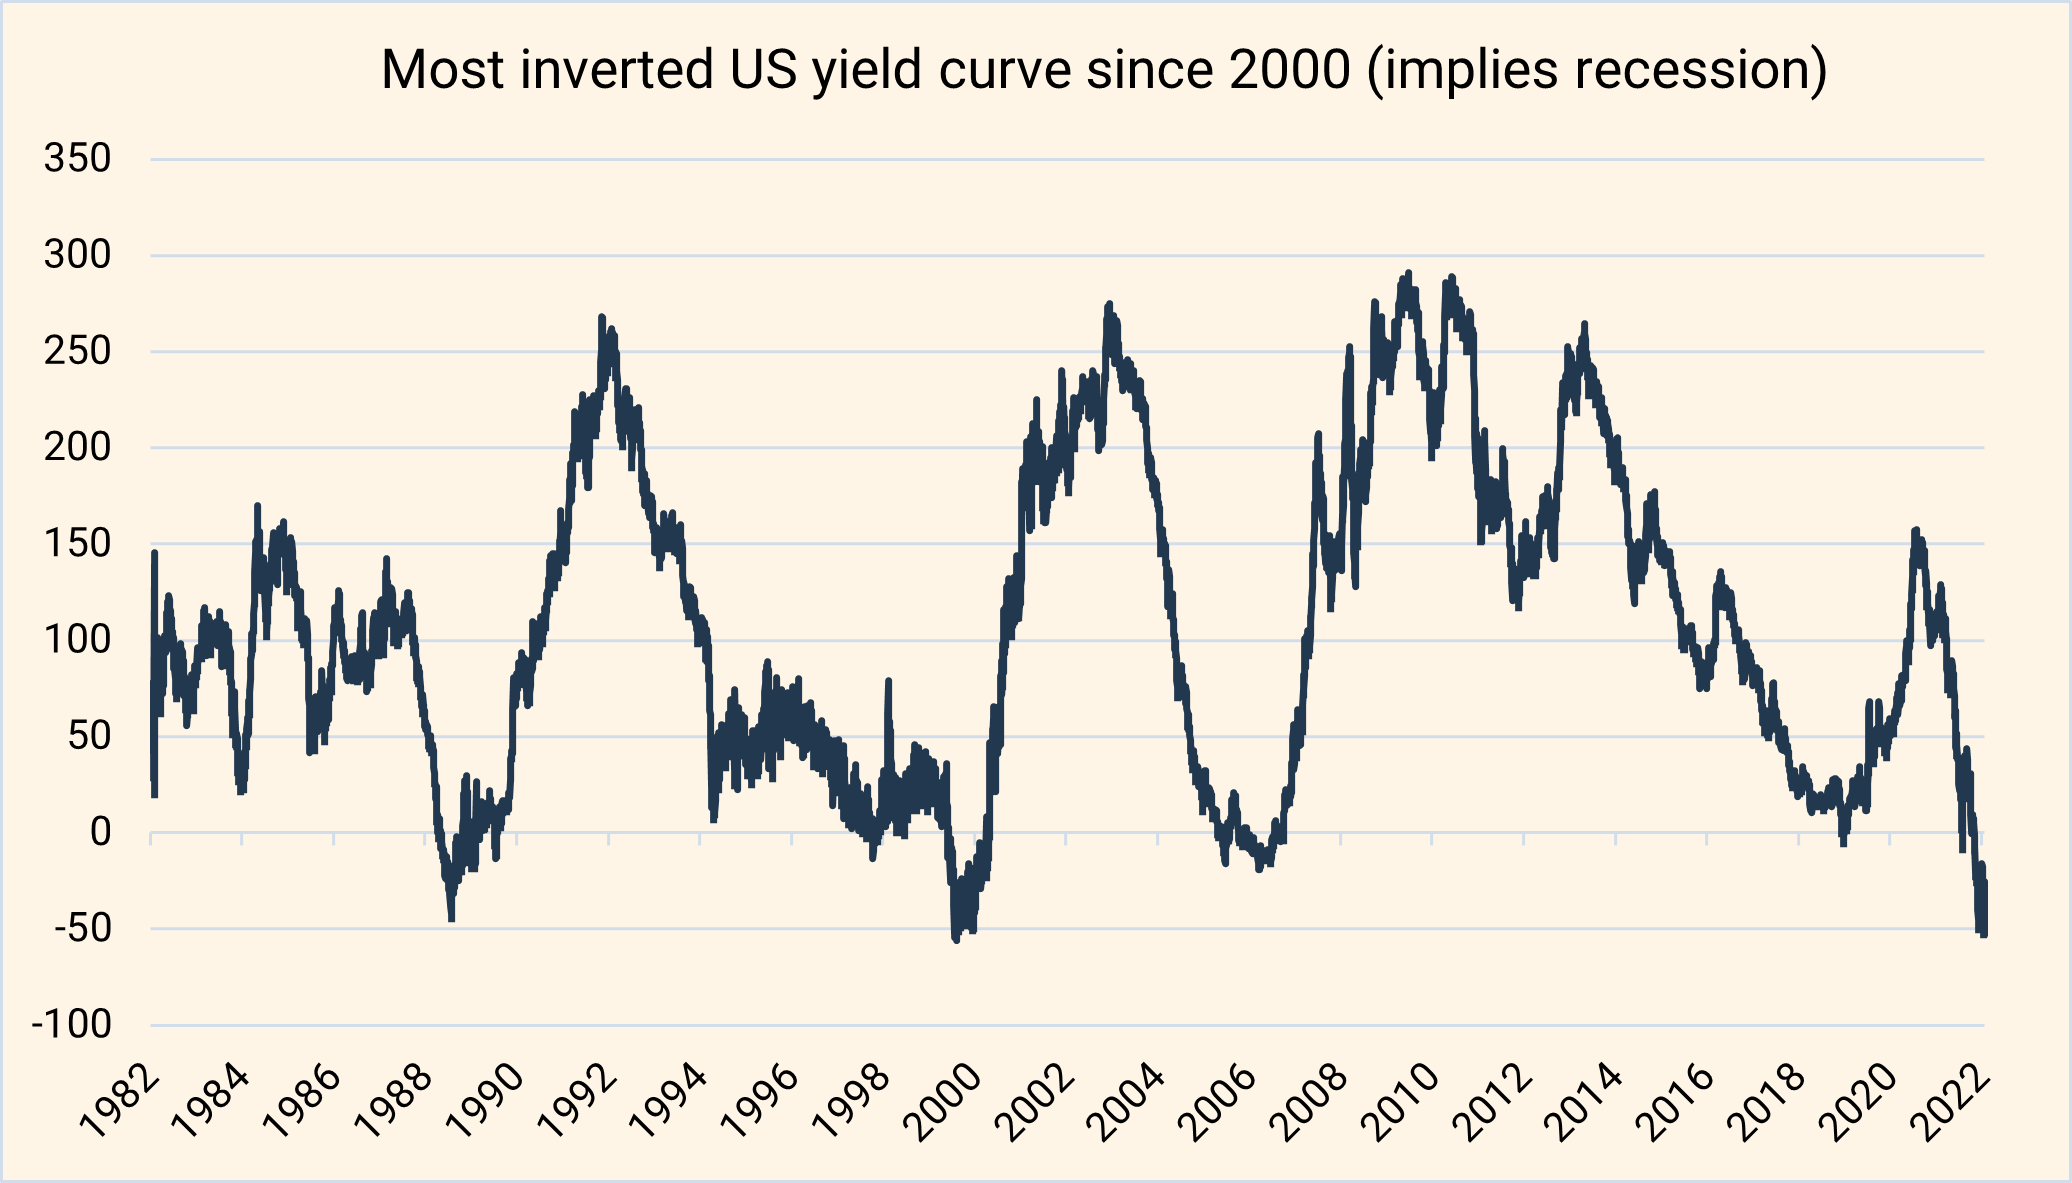
The yield curve is a graph of interest rates of different maturities for the same issuer. Normally, investors demand a higher interest rate to lend for longer periods since they are foregoing their capital for a longer time. For this reason, the yield curve is typically upward sloping reflecting higher yields for longer maturities. However, there are occasions when the yield curve inverts, meaning investors receive higher interest rates for shorter lending periods than for longer.
This is regarded as an indicator of recession. Prior to every US recession, the yield curve has inverted. For this reason some use an inversion as a predictor, however it has provided false positives on occasion (indicated a recession that didn’t happen). You can assess different parts of the curve, but investors typically look at the difference in two-year yields versus ten-year yields, as we show below. The two-year to ten-year US government bond yield curve is its most inverted for twenty years, implying a strong chance of a recession in the US.
Spreads
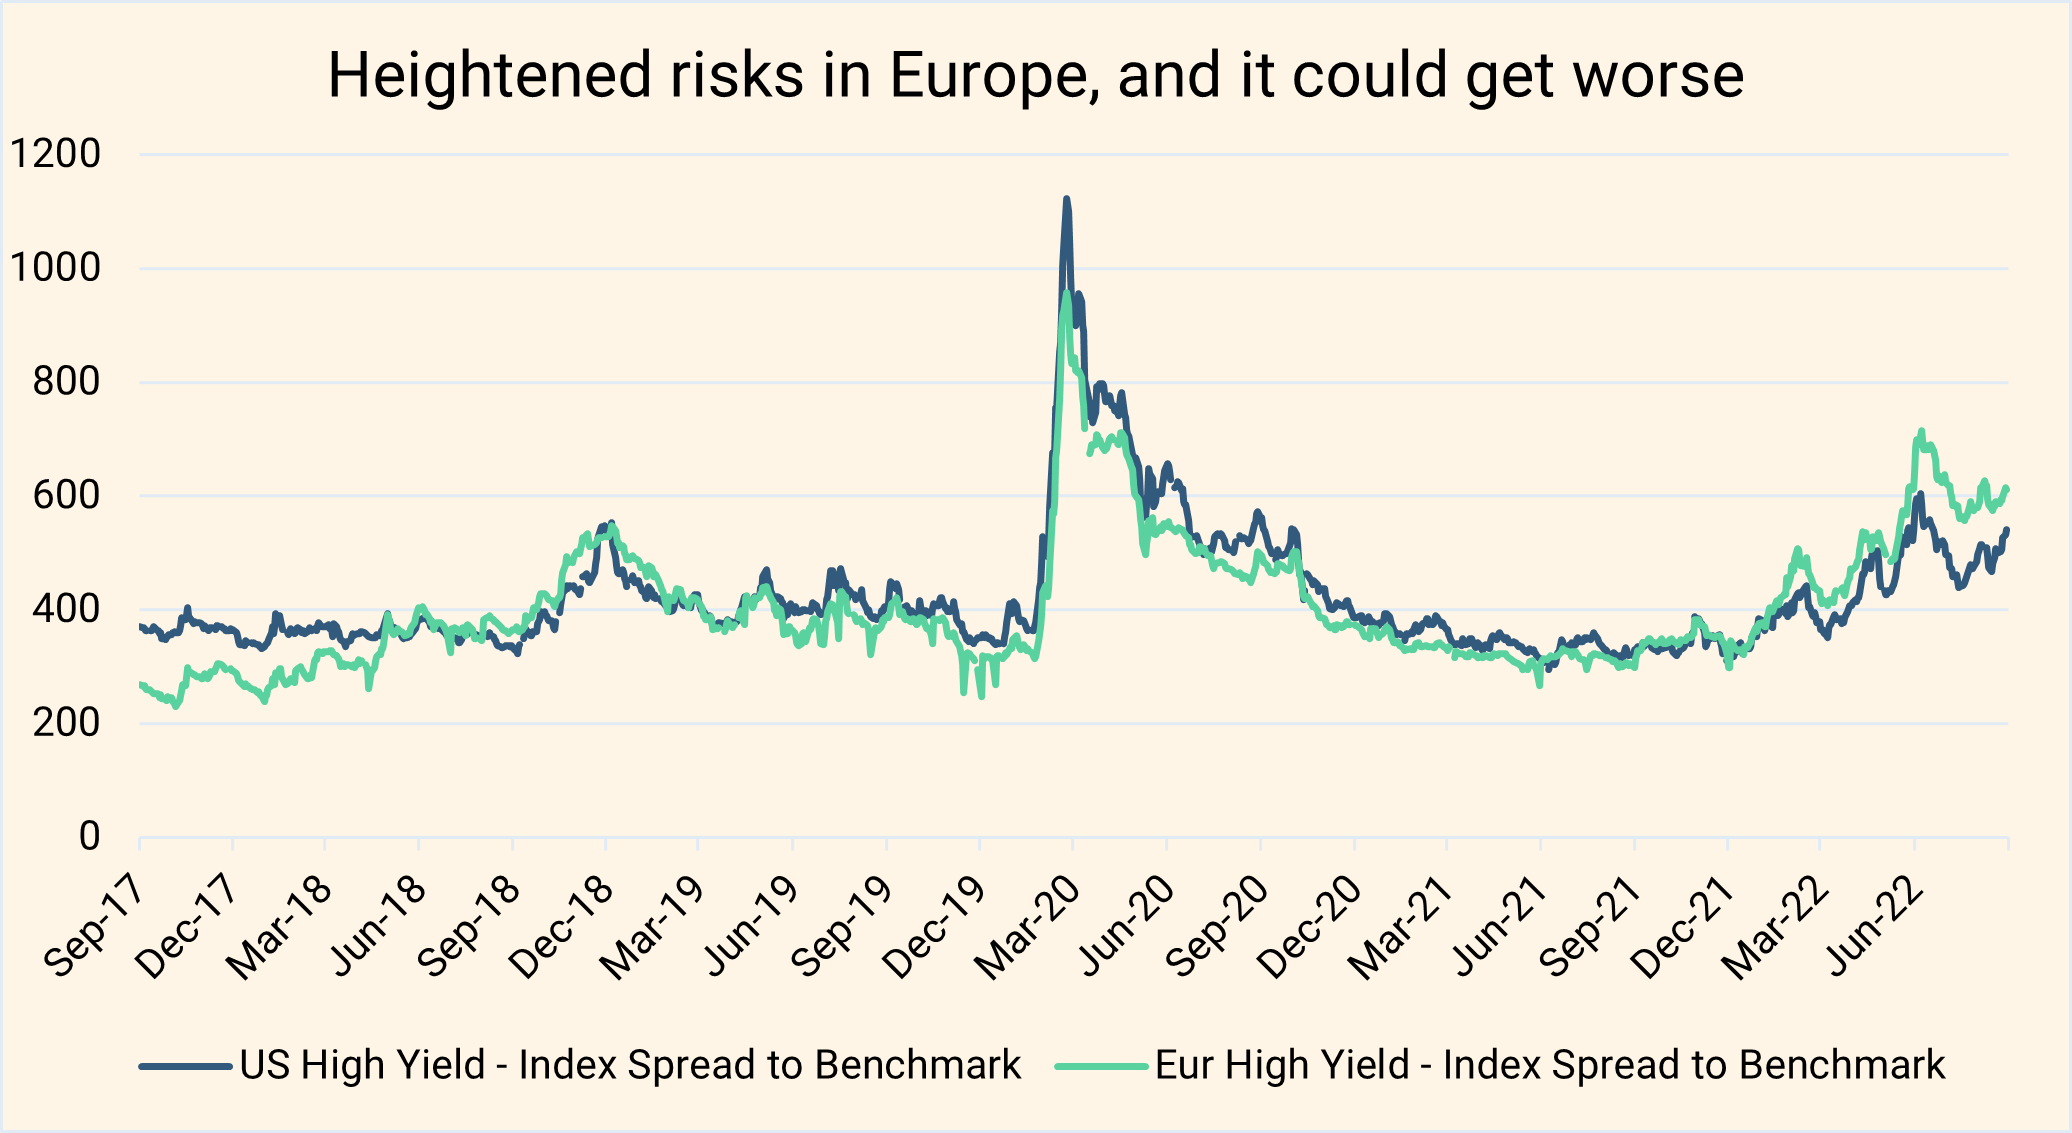
Looking at the additional yield (“spread”) of a bond over a benchmark rate (benchmark rates generally being short-dated government bonds), gives an indication of market perceptions of risk. The below chart shows how US and European spreads have increased since the start of the year, but they’re not currently discounting large-scale defaults as they did in the covid period. We feel that spreads could widen even further, which would cause further losses in high yield bonds.
Yield to worst
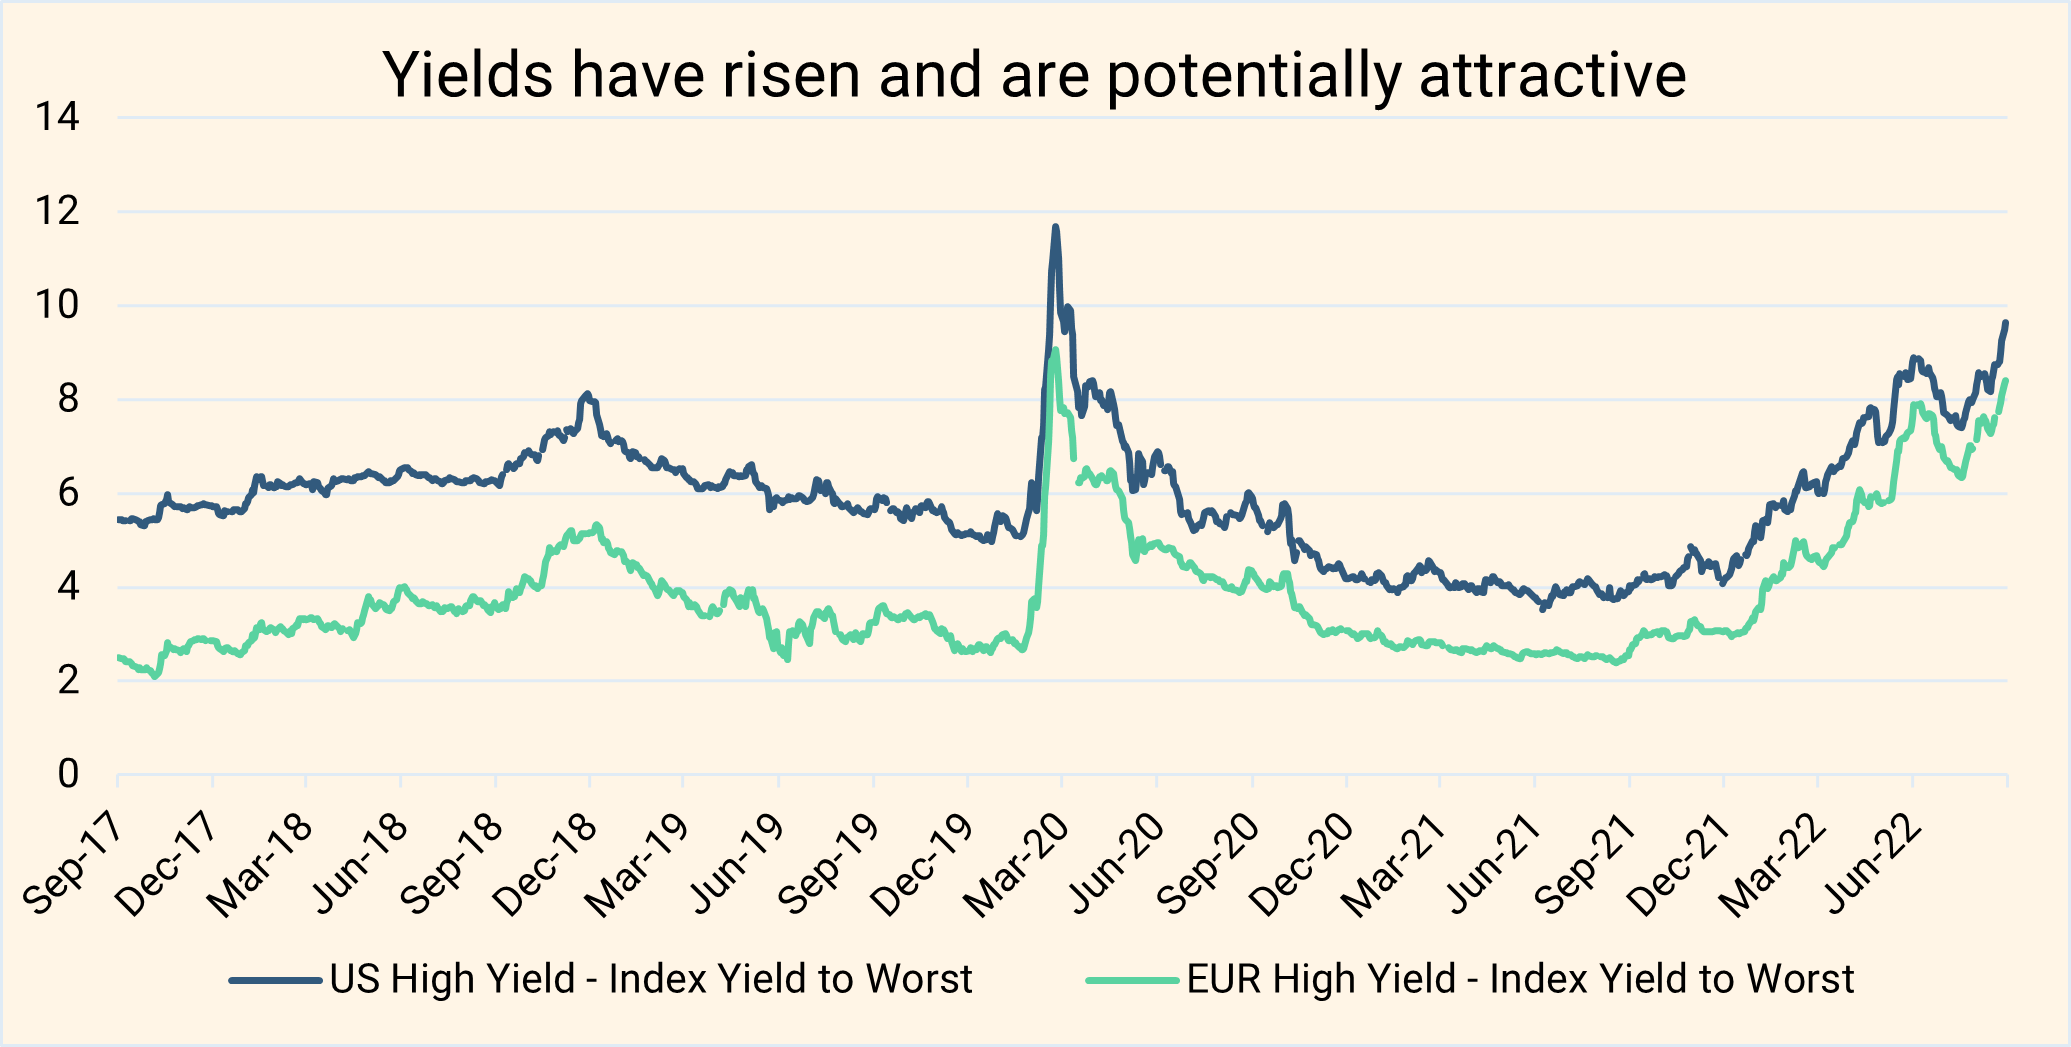
The “yield to worst” for a bond shows the lowest expected return from the asset, unless the bond defaults (in which case the yield would be much lower). The chart below shows how you can get an 8-10% yield on European and US high yield bonds currently. In our opinion these yields are beginning to look attractive, and we may look to increase our exposure. These are equity type returns, from a safer asset class (than equities), provided there aren’t large-scale defaults of course.
Credit default swaps
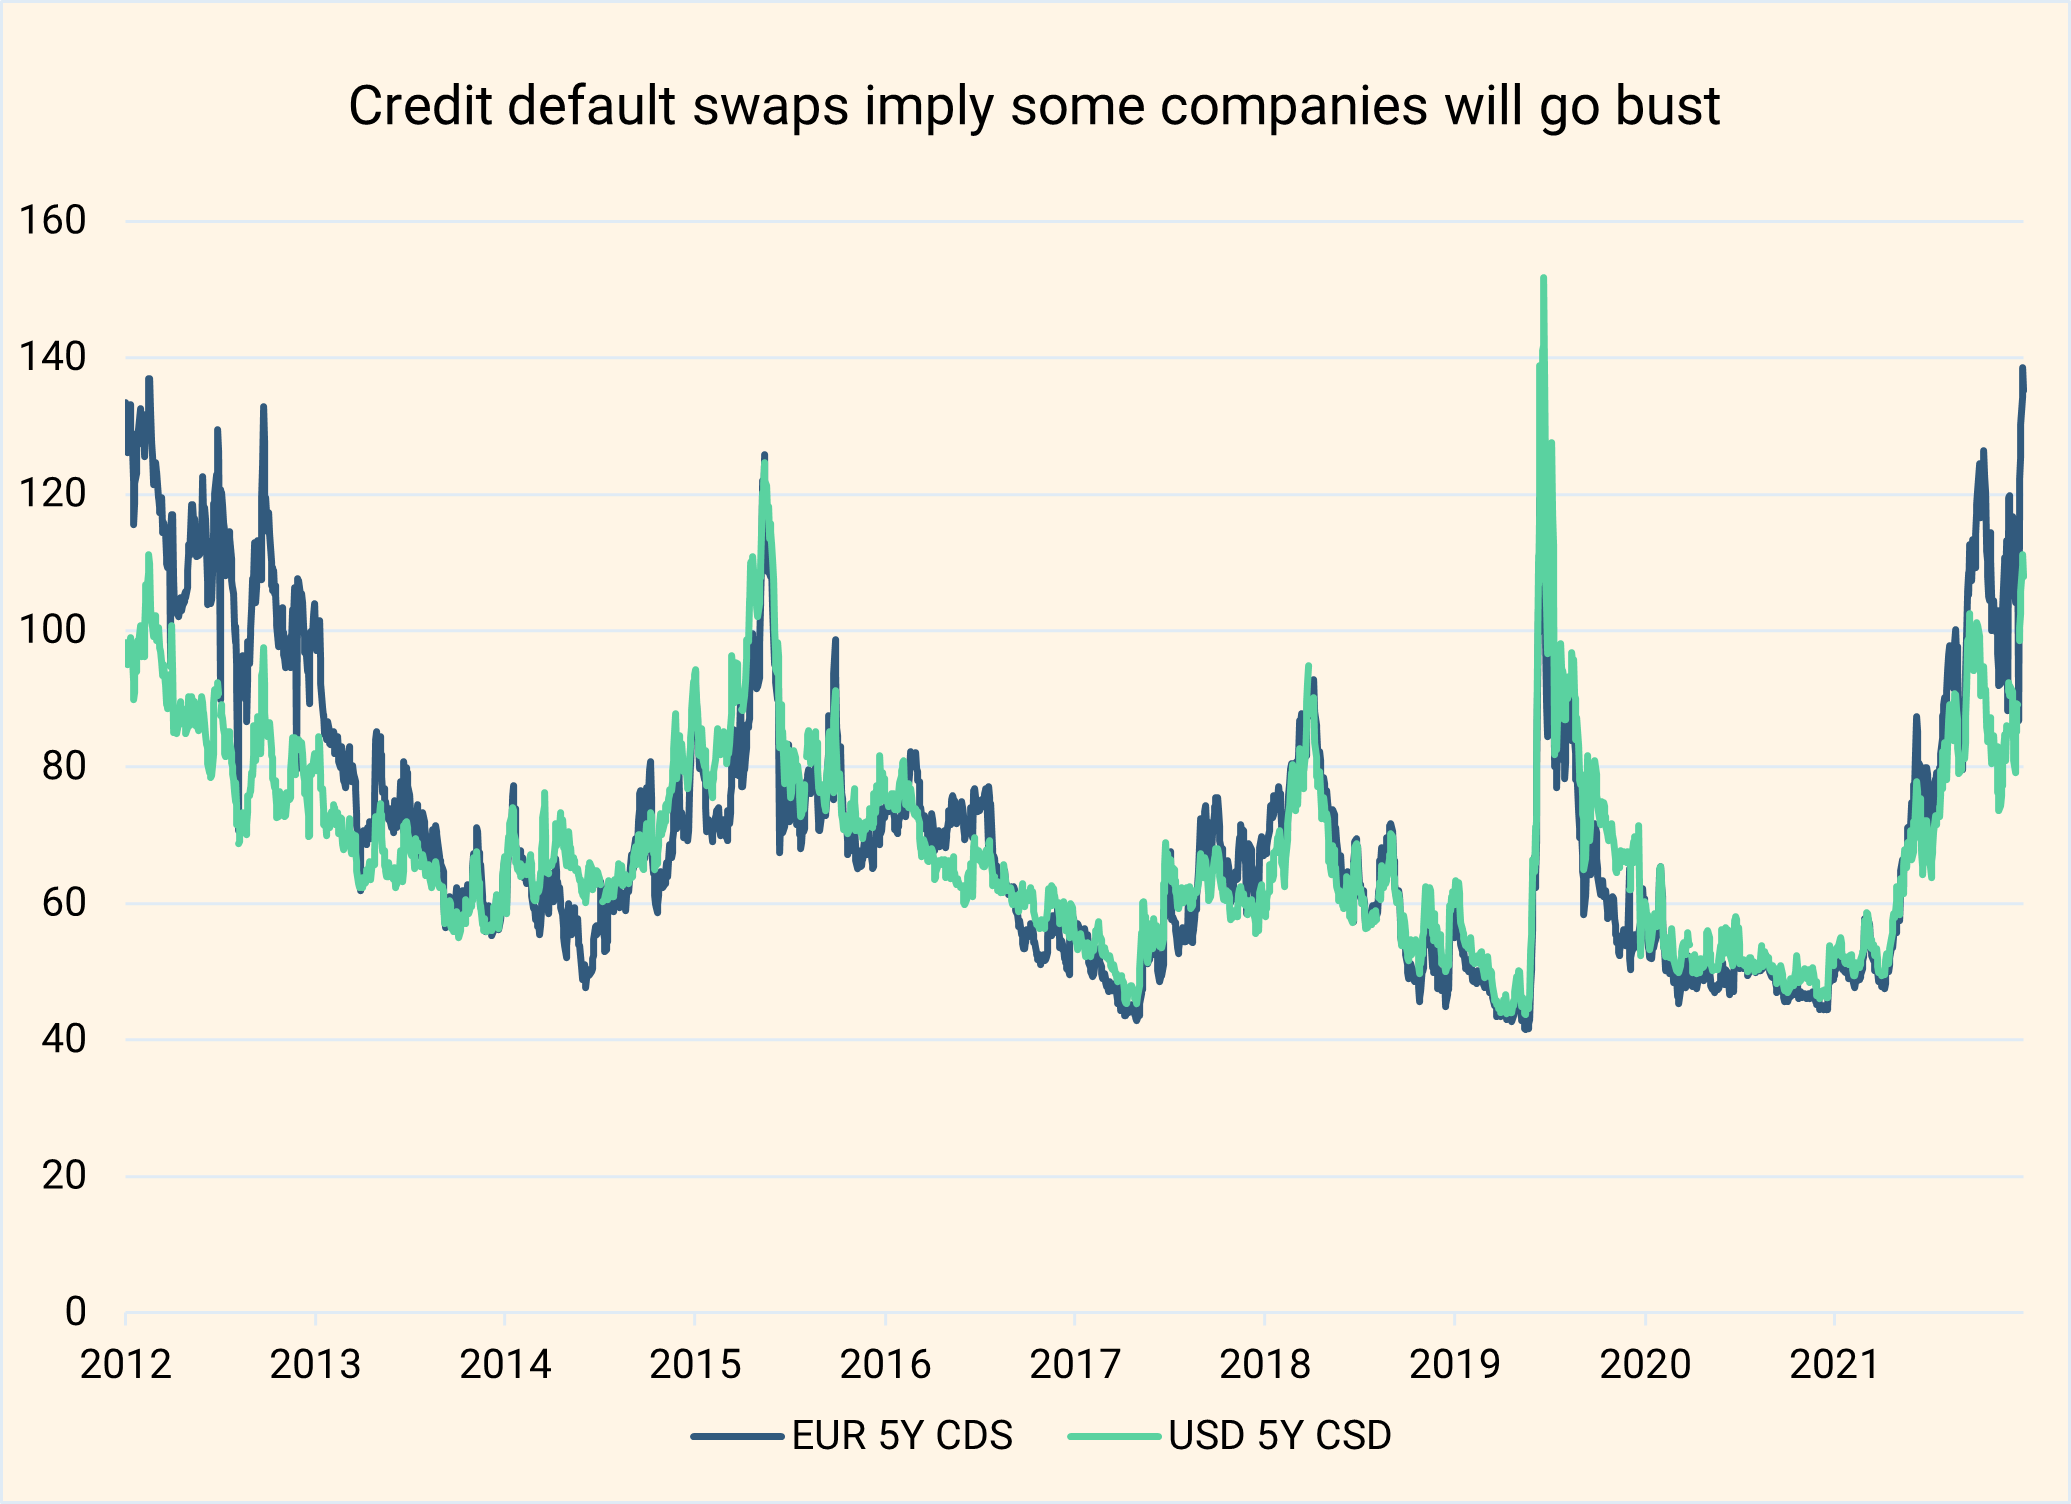
A credit default swap is an instrument that pays out in the event an issuer defaults. If an investor owns a bond and they become worried about the issuer defaulting, or if they don’t own the bond but they want to bet the issuer defaults, investors can buy a credit default swap on the issuer. One can infer the likelihood of default from how credit default swaps price in the market.
The chart below shows the price of five-year credit default swaps in Europe and the US. From this we can tell that market participants think some companies will go bust in the next five years, and that the market thinks this is more likely in Europe than in the US.
Looking forward
Having successfully avoided a lot of the pain in the bond market, we think government and corporate bonds are beginning to look more attractive since the yields have been driven so much higher.
That said, interest rates may continue to rise (so bonds may continue to fall), so we may get a better entry point in the near future. Additionally, we share the market’s concern about the risk of default, so whilst we do see opportunities, we’re being cautious and highly selective with client portfolios.
At some point interest rates are likely to fall again (which is why the yield curve is inverted), which would result in gains for the asset class. Markets move quickly and the speed of this reaction could surprise investors.
As we have seen this year, there are environments in which equities and bonds move in the same direction (for example when inflation and interest rates move sharply higher). So, whilst we may increase our bond exposure at some point, we will continue to focus on alternative asset classes to provide returns with low correlations to both bonds and equities, such as long lease property, macro hedge funds, and private assets.
Do you need help managing your investments?
Our team can recommend an investment strategy to meet your financial objectives and give you peace of mind that your investments are in good hands. Get in touch to discuss how we can help you.

Article sources
Editorial policy
All authors have considerable industry expertise and specific knowledge on any given topic. All pieces are reviewed by an additional qualified financial specialist to ensure objectivity and accuracy to the best of our ability. All reviewer’s qualifications are from leading industry bodies. Where possible we use primary sources to support our work. These can include white papers, government sources and data, original reports and interviews or articles from other industry experts. We also reference research from other reputable financial planning and investment management firms where appropriate.
The views expressed in this article are those of the Saltus Asset Management team. These typically relate to the core Saltus portfolios. We aim to implement our views across all Saltus strategies, but we must work within each portfolio’s specific objectives and restrictions. This means our views can be implemented more comprehensively in some mandates than others. If your funds are not within a Saltus portfolio and you would like more information, please get in touch with your adviser. Saltus Asset Management is a trading name of Saltus Partners LLP which is authorised and regulated by the Financial Conduct Authority. Information is correct to the best of our understanding as at the date of publication. Nothing within this content is intended as, or can be relied upon, as financial advice. Capital is at risk. You may get back less than you invested. Tax rules may change and the value of tax reliefs depends on your individual circumstances.
Related blog posts
About Saltus?
Find out more about our award-winning wealth management services…
Winner
Best Wealth Manager
Winner
Investment Performance: Cautious Portfolios
Winner
Top 100 Fund Selectors 2024
Winner
Best Places to Work 2024
£8bn+
assets under advice
20
years working with clients
350+
employees
97%
client retention rate


